RDNT Looks Bullish (1D)The price is showing bullish signs at the bottom.
Higher lows have formed, a trigger line has been broken, and the price has created a bullish iCH. It is now also above the demand zone.
A buy/long position can be entered upon a pullback to the demand zone.
The main targets have been marked on the chart.
If a daily candle closes below the invalidation level, this analysis will be invalidated.
For risk management, please don't forget stop loss and capital management
When we reach the first target, save some profit and then change the stop to entry
Comment if you have any questions
Thank You
RDNTUSDT trade ideas

$RDNT - Ready to fly?HIGH RISK
BINANCE:RDNTUSDT.P
NASDAQ:RDNT
The price recently broke out from the Inverted head and shoulder pattern, expecting the price to retest the yellow line.
Wait for the price action around the yellow line before entering it.
TP: Blue lines
SL: Redline / 4H CC below
Note: It'll be a swing trade, SL is wider then the regular SL, due to nature of the setup.
Low leverage and a 0.5% margin of the portfolio is recommended.
DYOR, NFA

RDNT/USDT 4H Chart: Inverted Head and Shoulders? Hey traders! Let’s dive into this 4-hour RDNTUSDT chart.
Radient Capital is setting up a classic pattern that could signal a big move!
We’re seeing an inverted head and shoulders forming, with the price breaking above the resistance of Wedge around $0.2290. The "head" bottomed out near $0.1590, with the shoulders forming at higher lows.
If this pattern plays out, we could see a bullish surge targeting $0.2650 and higher!
However, if the breakout fails, we might see a pullback to the shoulder low at $0.2160 or even the support at $0.1974.
Key Levels to Watch:
Resistance: $0.2650
Support: $0.2160 (shoulder)
Breakout Target: $0.2650+
Breakdown Risk: $0.1974
Is RDNT ready to soar, or will this breakout fail? Drop your thoughts below!

Radiant Capital: The Most Amazing Market Analyst In The WorldRadiant Capital is now up more than 100% since its 7-April bottom. It is still trading at bottom prices. Huge growth, high volume still bottom.
You can appreciate what I mean right?
The chart is easy.
By mentioning that a pair is still trading at bottom prices I mean to say that there is still plenty of room left available for growth.
I don't know how to say this without sounding like a narcissistic egotistical maniac; You have to trust me and only me!
Not because I believe I am the most amazing human being this life has to offer, no!, but because I know that I am wrong and I've been wrong many times but I learned from my mistakes.
You see, when I was reading the charts, back in the days, I knew that I couldn't predict how the market was going to move and that's ok. I knew it and I admitted this to myself but I continued to study and work.
It is different now; I can see it, I can see the chart.
» It is going up.
But why only me?
Because those that are learning are in the same place that I was years ago. We develop a bias, we become absorbed by it and then we start projecting our thinking into the public and rather than right we get it wrong. It is so hard, that you see the signals and you know but still you can't change course.
Since I know how hard it is because of my experience, I cannot trust you to trust anybody else whom I don't know how they are going through all the challenges that it takes to be able to see without the dark glasses that become darker with each follow. I don't know if this message is getting across.
It takes so much soul searching to be able to read a chart, that I can tell you that it is as hard as finding the meaning of your life in this world. It can be done, but it takes a lifetime of effort.
Do what you will but make sure to buy and hold.
If you enjoy the content, good for you, I enjoy writing... Sharing is my call.
Namaste.

RDNT detailed analysis **Detailed Analysis of RDNT/USDT 5-Day Chart**
**1. Trend Analysis**
- The chart depicts a **falling wedge pattern**, a bullish reversal signal.
- There has been a consistent downtrend with multiple sell signals in the past.
- However, recent price action suggests accumulation, with a "Buy" signal appearing at the lower boundary of the wedge.
- The stochastic RSI at the bottom indicates **oversold conditions**, hinting at a potential bounce.
**2. Buy Zone**
- The **best buy zone** appears within the **0.025 - 0.032 range**, aligning with support levels from past lows.
- The **falling wedge breakout level** around **0.035 - 0.038** would also serve as a confirmation entry for those preferring less risk.
**3. Sell Zone (Target Levels)**
- The first profit-taking zone is at **0.075 - 0.105**, marking a **254% potential upside**.
- If momentum continues, an extended target sits around **0.365**, the last major resistance.
**4. Risk Management**
- **Stop-loss:** Below **0.025**, invalidating the falling wedge pattern.
- **Risk-to-Reward (RR) Ratio:**
- Buying near **0.030**, stop-loss at **0.025**, and target **0.105**, offers an RR ratio of **1:10**.
- Conservative traders can aim for **0.075** for an RR of around **1:6**.
**Final Strategy & Execution Plan
-Buy Zone: 0.025 - 0.032
-Stop-Loss: 0.025 (tight) or 0.022 (safer)
-Take Profit:
--TP1: 0.075 (first resistance, safe exit)
--TP2: 0.105 (key breakout target)
--TP3: 0.365 (long-term hold)
**Confirmation Requirements:
-Breakout of wedge above 0.035 - 0.038
-RSI & Stochastic RSI bullish crossover
-Volume increase
Disclaimer: This is not a financial advice, just an educational content. DYOR

RDNT Trading Idea ( 1H)RDNT is testing the red resistance zone 🔴. If it breaks out successfully, the next target is the green line level 🎯

Sharks looking for buyers! Don't be one of the buyers!While Sharks (whales) looking for buyers in order to full fill their sell orders, All the indicators screaming buy!
Watch how accurate are our insights and how we are able to identify every single move of the market..
Don't buy this coin!!
Follow us for more

Attention!! Fake bullish patern!!Attention everyone.!
Fake bullish pattern from RDNT !
Opening long positions at this point will cost you a lot!

#RDNT: Empowering Cross-Chain DeFi LendingDescription:
This trading idea highlights RDNT (Radiant), a revolutionary DeFi protocol designed to enable seamless cross-chain lending and borrowing. RDNT aims to address the fragmentation of liquidity across different blockchain ecosystems by creating a unified platform where users can deposit assets on one chain and borrow against them on another. With its innovative technology, RDNT plays a critical role in advancing interoperability and efficiency within the DeFi space, making it a promising choice for investors seeking exposure to cutting-edge financial solutions.
Despite its potential, the cryptocurrency market is known for its volatility, and RDNT is no exception. External factors such as regulatory changes, market sentiment, and macroeconomic conditions can significantly impact its price. As such, caution and thorough risk management are essential for trading or investing in RDNT.
Disclaimer
This trading idea is intended for educational purposes only and should not be construed as financial advice. Trading cryptocurrencies, including RDNT, involves substantial risks, such as the potential loss of your entire investment. Always conduct detailed research, evaluate your financial situation, and consult with a professional financial advisor before making any investment decisions. Past performance does not guarantee future results.

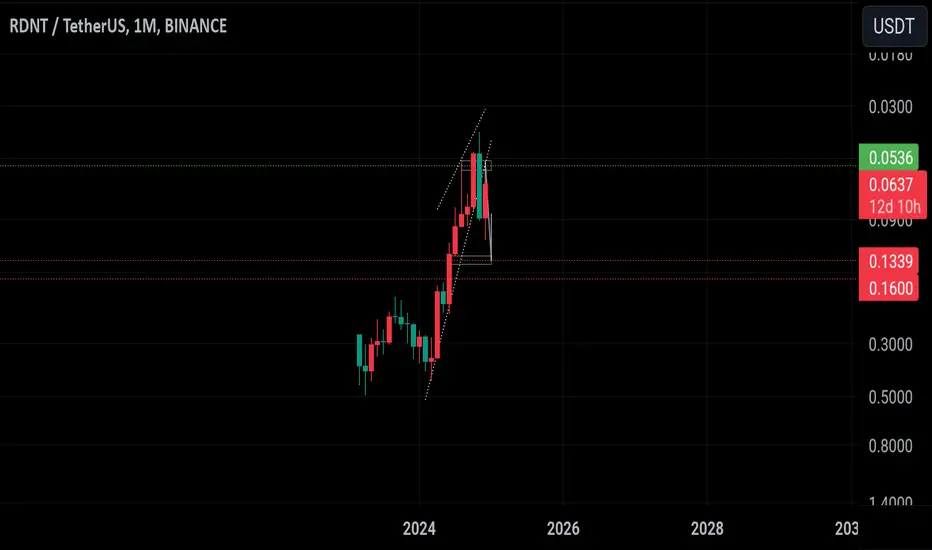
Don't miss this chanceYou can clearly see the breakout on the monthly chart. We're not in a bear market yet it's still bullish. and this actually can be the last chance to buy at these low prices. And NASDAQ:RDNT is one of the best options rn. I reccomend waiting longer because imo the prices will go down a lil bit more. But you can buy rn as well. If you're a short time trader sell a 0.13-1350. It can also forn a double bottom in that case the price can reach 0.16. I'll update the chart if the price reaches there.
Radiant Capital Breakout Down TrendAfter Breakout The price grew by about 50%
A possible supply area is shown
In case of penetration from the supply area, the price may return to the bottom and return to the supply area and failure.
The volume of transactions and the cap token market is very important.
The loss limit must be observed.
It is not a signal for buying and selling

RDNT can fly !#RDNT made a down trend and after that made a break out this can be the 1st wave and the correction is the 2nd wave i think that the demand zone will be touched and after that can make a huge rise

RDNT has a large bullish pattern!Before anything, it should be noted that an important trendline has been broken and the price has cleared a key range.
Upon further inspection, it seems there is a large QM pattern on the chart, and we can consider buying within the support zone of this QM.
Targets are marked on the chart.
The closure of a daily candle below the invalidation level will invalidate this analysis.
For risk management, please don't forget stop loss and capital management
When we reach the first target, save some profit and then change the stop to entry
Comment if you have any questions
Thank You

RDNTUSDT Long Setup Setting / FUTURES TradeBINANCE:RDNTUSDT
📈Which side you pick?
Bull or Bear
Low-risk status: 3x-4x Leverage
Mid-risk status: 5x-8x Leverage
(For beginners, I suggest low risk status)
👾Note: The setup is active but expect the uncertain phase as well. also movement lines drawn to predict future price reactions are relative and approximate.
➡️Entry Area:
Yellow zone
⚡️TP:
0.1119
0.1204
0.1316
🔴SL:
0.0893
🧐The Alternate scenario:
If the price stabilizes against the direction of the position, below or above the trigger zone, the setup will be canceled.

rdntAs long as the green lines are not broken, it can touch the red targets in the long term. Buying at the green and blue points can look attractive.

RDNT-USDT Long TrendRDNT can be long from here
it can break levels and touch his target
manage your risk plz

#RDNT (SPOT) entry range( 0.0420- 0.0620) T.(0.2970) SL(0.0387)BINANCE:RDNTUSDT
entry range (0.0420- 0.0620)
Target1 (0.0890) - Target2 (0.1160) - Target3 (0.1490) - Target4 (0.2040) - Target4 (0.2970)
1 Extra Targets(optional) in chart, if you like to continue in the trade with making stoploss very high.
SL .1D close below (0.0387)
*** this coin is defi & defi coins are pumping today, and still did not breakout so it may breakout so hard ***
______________________________________________________________
Golden Advices.
********************
* collect the coin slowly in the entry range.
* Please calculate your losses before the entry.
* Do not enter any trade you find it not suitable for you.
* No FOMO - No Rush , it is a long journey.
Useful Tags.
****************
My total posts
www.tradingview.com
1Million Journey
www.tradingview.com
www.tradingview.com
**********************************************************************************************
#Manta ,#OMNI, #DYM, #AI, #IO, #XAI , #ACE #NFP #RAD #WLD #ORDI #BLUR #SUI #Voxel #AEVO #VITE #APE #RDNT #FLUX #NMR #VANRY #TRB #HBAR #DGB #XEC #ERN #ALT #IO #ACA #HIVE #ASTR #ARDR #PIXEL #LTO #AERGO #SCRT #ATA #HOOK #FLOW #KSM #HFT #MINA #DATA #SC #JOE #RDNT #IQ #CFX #BICO #CTSI #KMD #FXS #DEGO #FORTH # AST #PORTAL #CYBER #RIF #ENJ #ZIL #APT #GALA #STEEM #ONE #LINK #NTRN #COTI #RENDER #ICX #IMX #ALICE #PYR #PORTAL #GRT #GMT # IDEX #NEAR #ICP #ETH #QTUM #VET #QNT #API3 #BURGER #MOVR #SKL #BAND #ETHFI.

RDNT 200%+ Expecting , hope its do #crypto #altHope its do, best trade if its does otherwise don't know
RDNT Dropped good i expect good recovery :)
(NFA its my personal trades)
Wish you good luck for your trading journey ,
-HestTrades

RdntHello snipers. On the one-day time frame, after a long time, it is exiting its long-term descending channel. It has reached the important resistance of the moving average (black line). If this resistance is broken, it can be expected to achieve higher prices. These are just possibilities.

RDNT will rock the skyLooking at the chart, RDNT appears to have completed the "cup" portion of the pattern, and may now be forming the "handle" component. the breakout could be estimated as follows:
1. depth of the cup appears to be around $0.40.
2.. The current price is around $0.0572, so the potential measured target price could be around $0.4572 ($0.0572 + $0.40).

RDNTUSDTHMT v1.0 spotted. Looking good with previous wave up with increasing volume and momentum.
- BOS (Breaks of Structure) at @ 0.05617-0.05715 level
- Trending slow and steady if able to hold above the BOS level
It is at extremely good reward to risk level.

RDNT/USDT Trading ScenarioAs a result of the cyberattack on Radiant Capital's protocol in October, their token RDNT lost value significantly, hitting an all-time low of $0.0375. According to the volume profile, many participants are actively accumulating the token at discounted prices, and the current decline is not deterring buyers. The protocol developers are also working on eliminating the consequences of the attack and strengthening security.
In the long term, the price is expected to recover and RDNT is to continue to grow during the altcoin season. Such situations with fundamental protocols often provide an opportunity for high returns over the medium to long term.

Is #RDNT Primed for a Major Move? Here’s What You Should KnowYello, Paradisers! Is #RDNTUSDT ready for a decisive after its recent hack or not? Let's discuss the latest analysis of #RadiantCapital:
💎After 5-6 months in a persistent downtrend, #RDNT is now at a pivotal moment. The price is approaching the critical support zone around $0.046-$0.053, setting up for a potential retest that, historically, has sparked bounces from this level. While #RadiantCapital recently suffered a hack, the question remains—can it finally break above the descending channel?
💎For #RDNTUSDT to generate any bullish momentum, it needs to clear the minor resistance at $0.074. Once a strong support, this level has become a key barrier that could determine RDNT’s short-term direction. A successful breakout above this line, especially if it coincides with increasing trading volume and support from the 20 EMA, would signal that bulls are ready to regain control, potentially propelling RDNT toward the next major resistance level.
💎However, failure to break through this resistance could result in a pullback toward the critical $0.046-$0.053 support zone, where another retest of this breakout point might unfold. Losing support here could lead RDNT to slide down to $0.040.
💎The real risk intensifies if $0.040 does not hold. A breakdown below this level would likely shift control firmly back to the bears, triggering a deeper correction and stalling hopes for any near-term bullish recovery.
Stay focused, patient, and disciplined, Paradisers🥂
MyCryptoParadise
iFeel the success🌴
