Reef will squeeze shorts, get ready Reef is getting ready to pop. Reef hasn't had a relief rally in a while. This could heat up quick
REEFUSDT.P trade ideas

reef 2024hi . i think this channel is valid yet and price is in the bottom of the channel . after break the red line price go up and aim price in long time is 0.0075 . i suggest when reach 0.0075 just sell your tokens. sorry for my weak English :))

REEFUSD another bearish chartWhy will reef coin simply fall apart in the next months and the price will reach new lows?
Now, as we see we have new descending triangle with possible target of 0.0007usd.
There is no good news here. To much optimists here...

Reef never had a bull runReef is an anomaly because it never had a true bull run. It launch and never actually ran up. The price just went down and has been consolidating. Though when you zoom out you realize its just one big consolidation. Would not be surprised to see this rocket higher next bull run. The longer the base the higher in space.
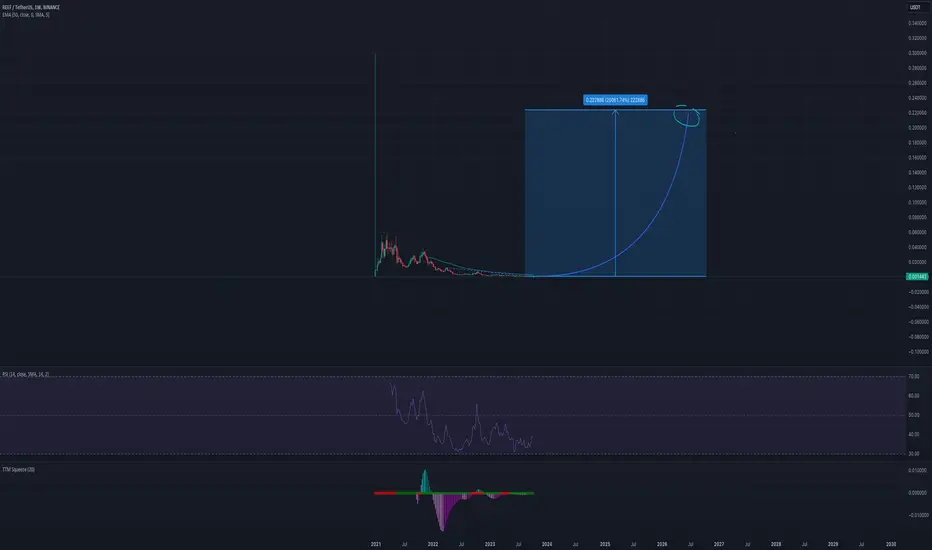
finally reef breaking out seems like reef has already bottomed out and getting ready for massive bullish rally
over all in downtrend since 2021 now formed and breaking falling wedge in 3 days tf while rsi printed massive bullish divergence incase of successful breakout of falling wedge expecting 300 to 320% bullish wave in midterm

REEFUSDT Price Breaking Ascending Channel!REEFUSDT Technical analysis update
Short level: $0.001375 - $0.00138
Stop loss : $0.00142
Take Profit 1 : $0.001335
Take Profit 2 : $0.00124
Take Profit 3 : $0.00111
Thanks
Hexa

REEF SetupLooking for price to get rejected at 0.0018 to 0.002 range.
FOMO will probably keep pumping the price, be careful market shorting aggressive rips.

REEF LONGFollowing a breakout of the previous resistance level and the formation of a new peak on the 4HR chart, I anticipate that REEF will undergo a correction to a lower price level where it can find support and then resume its uptrend towards the order block.

$REEF Keep eyes On breakout EURONEXT:REEF Performing Falling wedge in 1D Keep eye on Breakout
Falling Wedge
The falling wedge can either be a reversal or continuation signal.
As a reversal signal, it is formed at a bottom of a downtrend, indicating that an uptrend would come next.
As a continuation signal, it is formed during an uptrend, implying that the upward price action would resume. Unlike the rising wedge, the falling wedge is a bullish chart pattern.
In this example, the falling wedge serves as a reversal signal. After a downtrend, the price made lower highs and lower lows.
Notice how the falling trend line connecting the highs is steeper than the trend line connecting the lows.
If we placed an entry order above that falling trend line connecting the pair’s highs, we would’ve been able to jump in on the strong uptrend and caught some pips!
A good upside target would be the height of the wedge formation.

REEF/USDT Potential Bullish Move? REEF Analysis Today 💎Paradisers, heads up! REEFUSDT is on the move, having recently emerged from a triangle channel and now cruising within a demand zone. We're optimistic about a potential bullish climb.
💎In recent days, REEF has been confined to a particular bracket. Earlier, it encountered a ceiling at the bearish order block near the $0.001404 mark. With its current upward drive, it seems poised to test that barrier again.
💎Be watchful of the supply zone and the bearish order block identified on extended time frames; these are likely targets in the near term.
💎If, however, the REEF dips beneath the demand zone and crucial support, brace for a possible descent.
💎Stay sharp and stay tuned for further insights! 🌴

REEFUSDT 1DFalling Wedge formation on daily chart. If we do breakout, targets on the chart are on the table.

REEF and Good position for short ? REEF and Good position for short ?
Pullback to the upward trend line
Price divergence and RSI indicator
In the time frame of 15 minutes, keep an eye on the candle to confirm the entry

Reefisdt LongEntering into long from here 1625-1600.
Nice RR here if it holds the S/R flip untill close.
Closing it if it holds below 1580 (very tight).
Note: Not a Financial advice.

TA Dragon for REEFUSDT on Weekly TFTA Dragon for REEFUSDT on Weekly TF
Fibonacci levels + Chart pattern = 3 different scenarios

🚀💼 "Ignite Your Profits: REEFUSDT 1:8 R:R!" 📈💥🚀💼 Ready to Ignite Your Crypto Gains? 🔥💰
Get set for an explosive opportunity with REEFUSDT! 📈💪 The anticipation is building as REEFUSDT nears an exciting breakout, offering a potential 1:8 risk-to-reward ratio. 🚀🎯
💡 Calling all crypto traders and price action enthusiasts! 📊💻 Unleash the power of technical analysis and dive into this captivating example of a potential breakout. 📚💡
📚 Let's embark on a journey of price action learning, unveiling the dynamics of this impending breakout. Gain valuable insights and position yourself for explosive gains. 💼💡📚
⏳ Timing is everything, and the risk-to-reward ratio stands at a remarkable 1:8. 🌟💰 This setup opens doors to substantial returns for those who seize this exciting moment.
🔔 Like and share if you're eager to ignite your profits with REEFUSDT's potential breakout! Let's make this trade idea go viral worldwide, inspiring traders worldwide to harness the power of price action in their crypto ventures. 🌍💸🚀

REEFUSDTHello Traders,
Long Reef as we can see that reef is on the proper support and we can expect a pullup from here upto the upper resistence as per the chart. cheers!

#REEFHey, this is just a technical view that bears the wrong and the right, so do not rely on it, but use it to help you make the decision, and also do not neglect the financial management, and do not forget to follow up on social media if you are interested in bitcoin

#Reef longlong reef when it will come to the support line definetly it will bounce back from the support, have a keen eye on it.

Reef Ready To Fly Are you searching a coin can x your balance then here is Reef you can Measure Risk Reward of your balnce and take part in this xoin.
Your Balance Your Risk Your rewards.
Noone is responsible for that.
Long

Reef finance possible playout chartThe price movement of Reef is predicted to experience a significant increase with a potential gain of 12% in the coming days. Currently, it has already retested the support level at $0.18 and is expected to reach $0.2 in the near future. #DYOR (Do Your Own Research).

reef :(i think this scenario happening for reef . because head and shoulders pattern appear for it and also floor of three angel pattern broken to the down .

REEFUSDT wants a new bearish impulse?Reef Finance is a decentralized finance platform that aims to simplify and enhance the accessibility of DeFi services.
According to Plancton's Rules, a popular trading strategy, there is a potential scenario for REEFUSDT where the price could retest the 0.5 Fibonacci level before establishing a new short position. The Fibonacci retracement levels are a series of horizontal lines that indicate potential support and resistance levels based on the Fibonacci sequence.
In this particular case, the 0.5 Fibonacci level represents a critical support level for REEFUSDT. If the price reaches this level, it could attract buying interest from traders looking for a potential bounce or trend reversal. The significance of the 0.5 Fibonacci level is derived from the belief that it represents a halfway point in the potential retracement of the previous upward move.
Plancton's Rules suggest that before entering a new short position, it is important to wait for confirmation that the price has failed to hold above the 0.5 Fibonacci level. This confirmation could manifest as a significant rejection or bearish price action, indicating that selling pressure is likely to resume.
By waiting for the price to retest the 0.5 Fibonacci level and subsequently confirming a rejection, traders following Plancton's Rules aim to increase the probability of a successful short position. This approach allows them to capitalize on potential downward momentum and take advantage of the market's bearish sentiment.
–––––
Follow the Shrimp 🦐
Keep in mind.
🟣 Purple structure -> Monthly structure.
🔴 Red structure -> Weekly structure.
🔵 Blue structure -> Daily structure.
🟡 Yellow structure -> 4h structure.
⚫️ Black structure -> <= 1h structure.
Follow the Shrimp 🦐

REEFUSDTLook at the perfect chart about reef coin.
Before they mocked me and insulted me when I put the bear graph and when I wrote that price would go to ICO price (0,00125usd), but no one said that reading the graph is very important and imagination should be left for writing fairy tales.
Don't believe in fairy tales in coin market.
The RSI hinted at this decline as I wrote yesterday.
There is no enough volumen and it means that only way is down.
