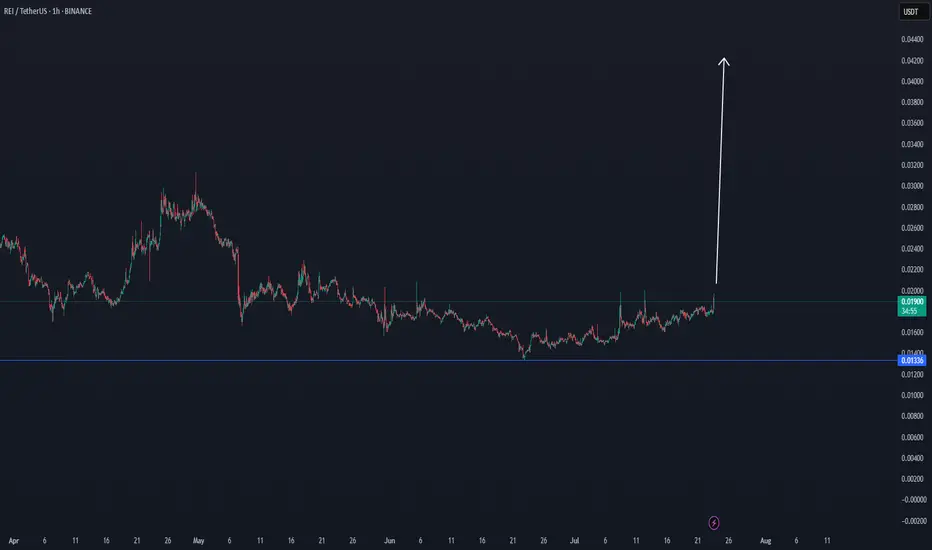
REI/USDT-God Candle REI has consistently defended the $0.015 zone for the past 40 days, signaling early signs of a potential reversal point in alignment with the broader market cycle. This base-building behavior suggests strong underlying demand, making it a high-potential setup. A breakout with a "god candle" could be the first major sign of trend reversal. The green box marks a prime entry zone, offering an excellent risk-reward opportunity for early positioning ahead of the next bullish leg.
REIUSDT trade ideas

REI/USDT CYCLE UPDATE $0,90 by 2025 - Price prediction📈 REI/USDT CYCLE UPDATE – $0.90 by 2025
REI could break above its old ATH, targeting $0.90 in the upcoming cycle. Why?
Upcoming
✅ Ultra-fast blockchain (⏱️ 1.5s block time)
✅ Gas-free or near-zero fees – perfect for DeFi, NFTs & gaming
✅ EVM-compatible – easy migration for Ethereum dApps
✅ Low market cap → high upside potential
✅ Clean tokenomics with staking + resource model
✅ Built for speed, scale & adoption
DATA
Data shows that there is a structural trend going on, where this coin can break soon.
If the altcoin market heats up, REI has the fundamentals & tech edge to explode past previous highs. 🚀
🧠 Watch this one closely.
#REINetwork #Crypto #Altseason #EVM #PricePrediction #Web3
This is not trading advice, but a view from a side of study.

REI/USDT THE NEXT WHALE INCREASE COIN $0,04 TargetREI/USDT THE NEXT WHALE INCREASE COIN
This coin seems to have a powerful DCA effect, which can be confirmed in the coming time frames with a break.
When there is interest, and new confirmations, here below the update.
entering this coin only when there are more confirmations
The first confirmation is to get first out of this box
REIUSDT – The Setup Is in the WaitingPatience is often underrated,
but waiting for price in the blue box might offer the best R:R scenario here.
📍 Strategy
If REIUSDT pulls back into the blue box,
and then gives a 1H structure break
with CDV supporting the move,
that’s where my plan activates.
🔁 What I’ll Watch For
✅ Controlled pullback
✅ CDV backing the breakout, not just wicks
✅ Clean 1H close above the box with structure forming
“Price is what you pay. Value is what you get.” – Benjamin Graham
"You don’t need to chase. You need to notice."
This setup isn’t about hope.
It’s about recognizing clarity when it forms.
📌I keep my charts clean and simple because I believe clarity leads to better decisions.
📌My approach is built on years of experience and a solid track record. I don’t claim to know it all but I’m confident in my ability to spot high-probability setups.
📌If you would like to learn how to use the heatmap, cumulative volume delta and volume footprint techniques that I use below to determine very accurate demand regions, you can send me a private message. I help anyone who wants it completely free of charge.
🔑I have a long list of my proven technique below:
🎯 ZENUSDT.P: Patience & Profitability | %230 Reaction from the Sniper Entry
🐶 DOGEUSDT.P: Next Move
🎨 RENDERUSDT.P: Opportunity of the Month
💎 ETHUSDT.P: Where to Retrace
🟢 BNBUSDT.P: Potential Surge
📊 BTC Dominance: Reaction Zone
🌊 WAVESUSDT.P: Demand Zone Potential
🟣 UNIUSDT.P: Long-Term Trade
🔵 XRPUSDT.P: Entry Zones
🔗 LINKUSDT.P: Follow The River
📈 BTCUSDT.P: Two Key Demand Zones
🟩 POLUSDT: Bullish Momentum
🌟 PENDLEUSDT.P: Where Opportunity Meets Precision
🔥 BTCUSDT.P: Liquidation of Highly Leveraged Longs
🌊 SOLUSDT.P: SOL's Dip - Your Opportunity
🐸 1000PEPEUSDT.P: Prime Bounce Zone Unlocked
🚀 ETHUSDT.P: Set to Explode - Don't Miss This Game Changer
🤖 IQUSDT: Smart Plan
⚡️ PONDUSDT: A Trade Not Taken Is Better Than a Losing One
💼 STMXUSDT: 2 Buying Areas
🐢 TURBOUSDT: Buy Zones and Buyer Presence
🌍 ICPUSDT.P: Massive Upside Potential | Check the Trade Update For Seeing Results
🟠 IDEXUSDT: Spot Buy Area | %26 Profit if You Trade with MSB
📌 USUALUSDT: Buyers Are Active + %70 Profit in Total
🌟 FORTHUSDT: Sniper Entry +%26 Reaction
🐳 QKCUSDT: Sniper Entry +%57 Reaction
📊 BTC.D: Retest of Key Area Highly Likely
📊 XNOUSDT %80 Reaction with a Simple Blue Box!
📊 BELUSDT Amazing %120 Reaction!
📊 Simple Red Box, Extraordinary Results
📊 TIAUSDT | Still No Buyers—Maintaining a Bearish Outlook
📊 OGNUSDT | One of Today’s Highest Volume Gainers – +32.44%
📊 TRXUSDT - I Do My Thing Again
📊 FLOKIUSDT - +%100 From Blue Box!
📊 SFP/USDT - Perfect Entry %80 Profit!
📊 AAVEUSDT - WE DID IT AGAIN!
I stopped adding to the list because it's kinda tiring to add 5-10 charts in every move but you can check my profile and see that it goes on..

REIUSDT Forming Falling WedgeREIUSDT is showing an encouraging technical setup that could pave the way for a potential price breakout. The pair has recently formed a classic falling wedge pattern, which historically signals a bullish reversal. Backed by healthy trading volume, this setup suggests that investors are positioning themselves early for what could be a significant upside move. With an expected gain of 60% to 70%+, REIUSDT is attracting the attention of traders who look for hidden gems in the altcoin market.
The REI Network project continues to gain recognition for its focus on creating a lightweight and high-performance blockchain, appealing to developers and users who value efficiency. This growing ecosystem and its active community are contributing to increased buying interest and renewed confidence in its long-term potential. Such fundamentals, combined with supportive technical signals, make this pair a strong candidate for swing trades in the coming weeks.
Technically, traders should watch for a decisive breakout above the wedge resistance line, which could trigger rapid price action towards the projected targets. Monitoring volume spikes and daily closes will be crucial in validating the strength of this breakout. As momentum builds, REIUSDT could deliver solid gains for traders who are prepared and patient with their entries.
✅ Show your support by hitting the like button and
✅ Leaving a comment below! (What is You opinion about this Coin)
Your feedback and engagement keep me inspired to share more insightful market analysis with you!

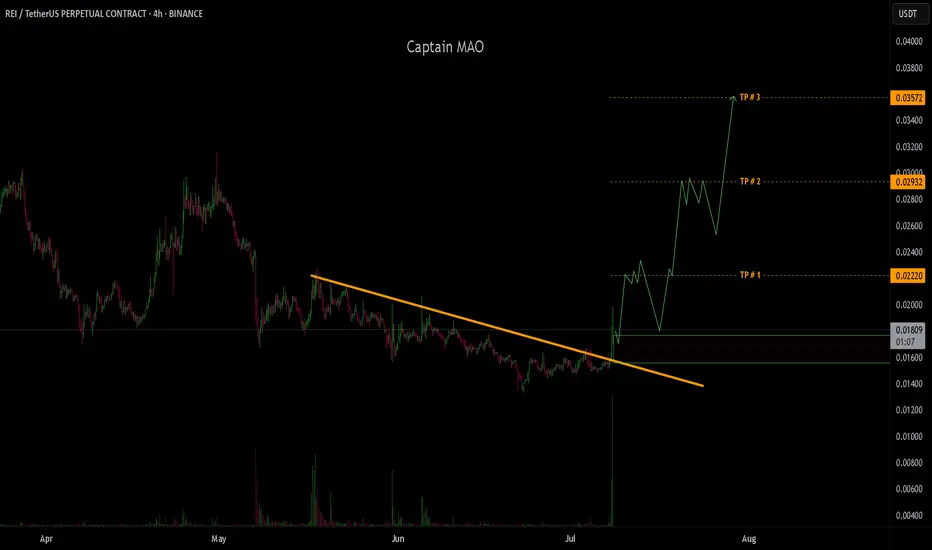
REI/USDT bullish REI has broken out of a 51-day downtrend with a strong volume spike, signaling aggressive buyer interest and potential trend reversal. The price successfully reclaimed the key $0.0166 S/R flip zone, further confirming bullish momentum.
Entry :
Wait for a retracement to the $0.017 zone to initiate entries. If price dips lower, plan to DCA down to $0.0155 to strengthen position.
Take Profit :
• TP1: $0.022
• TP2: $0.029
• TP3: $0.035
Stop Loss (optional): below $0.014 to invalidate bullish setup.
REIUSDT | Potential Support Zones Marked by Blue BoxesREIUSDT has been on my radar due to the volume and orderflow strength it’s shown recently. The blue boxes on the chart highlight areas where buyers have historically stepped in, making them prime zones to watch for a rebound.
Why These Levels Matter
• Blue boxes represent previous demand zones where price paused its decline and reversed.
• When price returns to these areas, the odds of a meaningful reaction increase significantly.
How to Play It
Wait for price to dip into a blue box
Look for a clean higher‑low on a lower timeframe (5‑ to 15‑minute chart)
Confirm with CDV divergence or an uptick in buying volume
Enter a long position only after these confirmations appear
Stay Flexible
I will not insist on any bullish view if price breaks below these zones without giving a proper low‑timeframe breakout back above. If instead we see a decisive break above with volume and a retest, I’ll switch bias and look for shorts at the next resistance.
These support levels aren’t random—they’re based on real market behavior. Let price prove itself first then act with confidence rather than chasing every move.
📌I keep my charts clean and simple because I believe clarity leads to better decisions.
📌My approach is built on years of experience and a solid track record. I don’t claim to know it all but I’m confident in my ability to spot high-probability setups.
📌If you would like to learn how to use the heatmap, cumulative volume delta and volume footprint techniques that I use below to determine very accurate demand regions, you can send me a private message. I help anyone who wants it completely free of charge.
🔑I have a long list of my proven technique below:
🎯 ZENUSDT.P: Patience & Profitability | %230 Reaction from the Sniper Entry
🐶 DOGEUSDT.P: Next Move
🎨 RENDERUSDT.P: Opportunity of the Month
💎 ETHUSDT.P: Where to Retrace
🟢 BNBUSDT.P: Potential Surge
📊 BTC Dominance: Reaction Zone
🌊 WAVESUSDT.P: Demand Zone Potential
🟣 UNIUSDT.P: Long-Term Trade
🔵 XRPUSDT.P: Entry Zones
🔗 LINKUSDT.P: Follow The River
📈 BTCUSDT.P: Two Key Demand Zones
🟩 POLUSDT: Bullish Momentum
🌟 PENDLEUSDT.P: Where Opportunity Meets Precision
🔥 BTCUSDT.P: Liquidation of Highly Leveraged Longs
🌊 SOLUSDT.P: SOL's Dip - Your Opportunity
🐸 1000PEPEUSDT.P: Prime Bounce Zone Unlocked
🚀 ETHUSDT.P: Set to Explode - Don't Miss This Game Changer
🤖 IQUSDT: Smart Plan
⚡️ PONDUSDT: A Trade Not Taken Is Better Than a Losing One
💼 STMXUSDT: 2 Buying Areas
🐢 TURBOUSDT: Buy Zones and Buyer Presence
🌍 ICPUSDT.P: Massive Upside Potential | Check the Trade Update For Seeing Results
🟠 IDEXUSDT: Spot Buy Area | %26 Profit if You Trade with MSB
📌 USUALUSDT: Buyers Are Active + %70 Profit in Total
🌟 FORTHUSDT: Sniper Entry +%26 Reaction
🐳 QKCUSDT: Sniper Entry +%57 Reaction
📊 BTC.D: Retest of Key Area Highly Likely
📊 XNOUSDT %80 Reaction with a Simple Blue Box!
📊 BELUSDT Amazing %120 Reaction!
📊 Simple Red Box, Extraordinary Results
I stopped adding to the list because it's kinda tiring to add 5-10 charts in every move but you can check my profile and see that it goes on..

REI is going down?! REI/USDT is showing clear signs of bearish momentum after a failed breakout above the key resistance zone. Here’s why I’m leaning bearish:
Failed Breakout at Resistance: The price briefly spiked above the resistance zone (0.02093–0.02244) but couldn’t hold, peaking at 0.02300 before a sharp rejection. This failure to sustain the breakout suggests strong selling pressure at higher levels, likely from profit-taking or institutional sell-offs.
Bearish Confirmation: A break below 0.02089 would confirm the bearish bias, potentially driving the price toward 0.01962 or lower (0.01791). The recent high-volume rejection at 0.02300 supports the idea of a bearish reversal.
Trade Idea:
Consider shorting below 0.02089 (on confirmation of the break).
Target: First target at 0.01962, with a deeper target at 0.01794
Stop Loss: Place above 0.02244.

REI Buy/Long Setup (1D)REI has hit a very significant support zone.
It is expected that the buy orders entering this symbol will be sufficient to create a bullish swing wave.
As long as the demand zone holds, the price can move toward the targets.
targets: 0.02482 _ 0.02948 _ 0.03402
A daily candle closing below the invalidation level would invalidate this analysis.
Do not enter the position without capital management and stop setting
Comment if you have any questions
thank you

REIUSDT 1D#REI has bounced off the support on the daily timeframe nicely. In case of a breakout above the Ichimoku cloud and the descending resistance, the targets are:
🎯 $0.02692
🎯 $0.03440
🎯 $0.04497
🎯 $0.05352
🎯 $0.06207
🎯 $0.07424
⚠️ Use a tight stop-loss.

REIUSDT Forming a Bullish Falling Wedge
REIUSDT is currently trading within a well-defined falling wedge pattern, a classic technical formation that often signals an imminent bullish reversal. As price action tightens near the apex of the wedge, REI is showing strong signs of accumulation, supported by a solid bounce from a major horizontal support zone. This key level has held multiple times, indicating buyers are stepping in with increasing conviction.
Volume is picking up in recent sessions, further validating the possibility of an upcoming breakout. A falling wedge breakout, especially with rising volume, tends to trigger powerful rallies. In this case, the projected move could see REIUSDT appreciating by 200% to 250%, targeting previous highs and major resistance levels from earlier cycles. Such explosive upside aligns well with the technical structure and growing investor attention around the project.
This setup offers a favorable risk-to-reward scenario for swing traders and mid-term investors who are watching for altcoin breakouts. With broader market sentiment leaning bullish and renewed interest flowing into undervalued coins, REIUSDT stands out as a compelling opportunity. The coin’s ability to maintain support while coiling within the wedge is a bullish signal in itself.
✅ Show your support by hitting the like button and
✅ Leaving a comment below! (What is You opinion about this Coin)
Your feedback and engagement keep me inspired to share more insightful market analysis with you!

REIUSDT.4HAs we look at the REI/USDT 4-hour chart, we observe several critical patterns and indicators that suggest potential market movements. The chart shows a clear support line marked in green, rising steadily since late July. This upward trend indicates a consistent buying interest at higher lows each time the price tests this line, a bullish signal for traders considering long positions.
The price is currently forming a symmetrical triangle, noted by converging trendlines, suggesting a period of consolidation. Such patterns typically lead to a breakout. The direction of the breakout, however, is dependent on broader market sentiment and upcoming volume. As we approach the apex of the triangle, the likelihood of a significant price move increases.
I also notice a resistance level at approximately $0.06003 (marked as R2 on the chart), which has previously acted as a strong psychological barrier. A breakout above this level could validate a bullish trend continuation, potentially testing previous highs around $0.07112.
Looking at the indicators, the MACD is hovering near the zero line, indicating a balance between buying and selling pressures. The RSI, positioned at around 48, is neutral, suggesting there's room for upward or downward movement without immediate concerns of being overbought or oversold.
Given these observations, my strategy would be to monitor the triangle's apex closely. A breakout above the resistance with increased volume could be a signal to consider a long position, aiming for the next resistance levels. Conversely, a breakdown below the green support line might indicate a shift to bearish sentiment, prompting me to look for potential exit points or short opportunities. As always, it's crucial to set appropriate stop-loss orders to manage risks effectively in these volatile conditions.

REIUSDTWe can attempt to buy REIUSDT from specified level as it makes HL , also there is no bearish divergence occur indicate that it moves upward.
SL , TP mention in chart.

Rei / Usdt BINANCE:REIUSDT
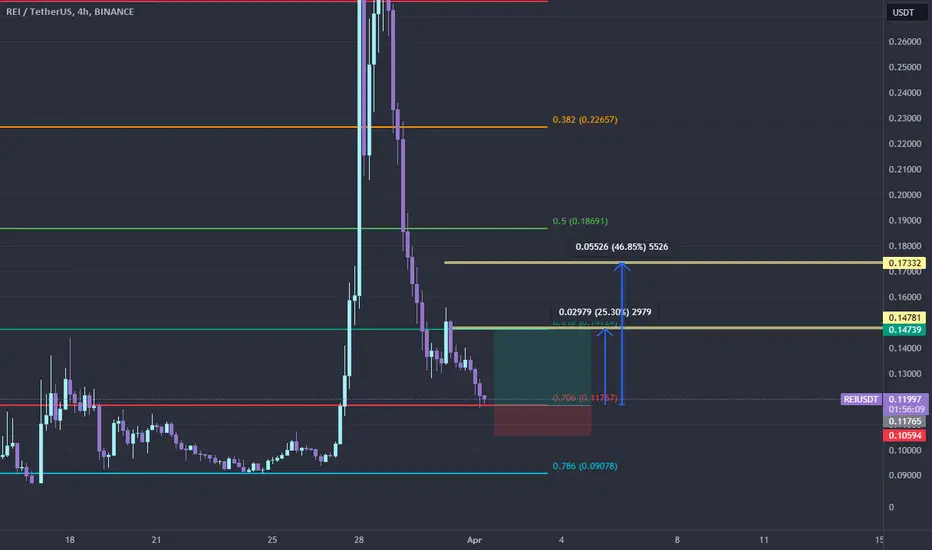
Currently, the price of Rei (REI) stands at $0.04289. This level is crucial for determining the short-term trend of the asset. If the price fails to maintain this level, the next support zone to watch is at $0.0380. Support levels are points where buying interest typically increases, potentially halting or reversing a downward price movement. If REI's price falls to $0.0380 and fails to find sufficient buying pressure, it may continue to decline, signaling weakness in the market.
Conversely, if the price of REI holds above $0.04289, it could indicate stability and potential for further gains. In such a scenario, traders would look towards resistance zones as key levels to watch. For REI, the resistance zones are identified at $0.04700 and $0.05666. Resistance levels are where selling pressure might intensify, making it challenging for the price to rise further. If the price approaches these levels, it may face difficulties breaking through and could potentially reverse or consolidate.
Monitoring these support and resistance levels helps traders and investors anticipate potential price movements and make informed decisions. If REI maintains its current price or climbs, resistance levels will be crucial in assessing the asset's upward potential.
Disclaimer : I Am Not Financial Adviser

REIUSDTWe can attempt to short REIUSDT from specified level as it break HL ,also trading double top (reversal pattern) , also bearish divergence occur indicate that it moves downward.
SL , TP mention in chart.

Will REI Network (#REI) Hold Its Ground or Take a Plunge?Yello, Paradisers! Have you been keeping an eye on REINetwork (#REI)? Our latest analysis suggests a critical moment is approaching. Let’s dive into the details.
💎#REIUSDT has been trading within a falling wedge pattern on the 1D timeframe. We've previously observed a failed breakout, which reinforces a bearish bias. Currently, #REINetwork is retesting the falling wedge's lower support level, and there is a possibility that it might drop further.
💎The diminishing trading volume and the POC of VRVP acting as resistance increase the chances of a further drop. If #REI fails to hold the support at the falling wedge's lower boundary, it's likely to retest the Bullish Order Block (OB) around $0.447.
💎However, if AMEX:REI fails to hold at $0.447, the next support level to watch is at $0.325. This area is packed with liquidity and can create a good chance of a pullback if tested.
💎On the contrary, if the falling wedge's lower support level holds well, we could see the bulls taking control, leading to a bullish rally. The overall market sentiment and Bitcoin's movement will significantly influence #REI's price action, so keep a close eye on these factors.
Stay focused, patient, and disciplined, Paradisers.
MyCryptoParadise
iFeel the success🌴

Rei/USDTThis is an update for the previous posts . Rei has came down and for now its not going any further down . i have bought more to average my price for this Trade . The day i will close this trade i will update . along with screenshots of all orders and profit . If anyone is in this trade its a great time to average the quantity of REI/USDT . It can go down from here so its better not to put all money in this trade keep some amount in the backup as well .

REI / REIUSDTGood Luck >>
• Warning •
Any deal I share does not mean that I am forcing you to enter into it, you enter in with your full risk, because I'll not gain any profits with you in the end.
The risk management of the position must comply with the stop loss.
(I am not sharing financial or investment advice, you should do your own research for your money.)

REI I might buy again when the price breaks out from this trend line. Let's see if this coin will scam us again.

REI/USDTAs Predicted REI has Broken the downtrend and reversed to UPTREND . I will update Screenshot of entry and Exit and amount i made from this trade .

Rei updateRei will bounce back to .20 cents or more . I have bought Rei ( 25000 ) quantity approx . At an average price of .11 cents .

REI BULLISHI believe this is a scam coin as it has dropped by more than 60% in just a couple of days, making it a risky trade. However, there's a possibility of seeing a bounce from the golden zone. I've bought in here with a stop loss in place. For me, this trade is very risky.
REI USDT is trading BullishREI USDT Is Trading in Bullish and printing higher Highs and higher low series.
Trade can be can at lower high and lower low.
