$REN #REN Possible ReversalNot financial advise just my personal analysis and chart for tracking purposes.
Expect to see 900-1000 sats short to mid term. Possible we see another retest below 800 sats before going up.
Project has strong fundamentals & team.
Floating around historical support.
Daily MACD is bullish.
RENBTC trade ideas


#REN : Upto 75% Profits Opportunity In The Mid Term.#Accumulation_Recommendation
Pair : #REN / #BTC
Technical Analysis
Pattern Creation : On the daily time frame of REN and BTC pair on Binance we have seen that a creation of a bullish engulfing candle stick with a good shape of a falling wedge. It is still trying to break out from the falling wedge and can't be considered as a confirmed call unless we see a close above the resistance line of the triangle.
Indications :
Volume showed a very good amount of increase on the yesterday candle but is currently showing a slow and decreasing volume level on today's scenario. This might be taken as an indication for a false pump if the trading volume continues to decline further by the following days.
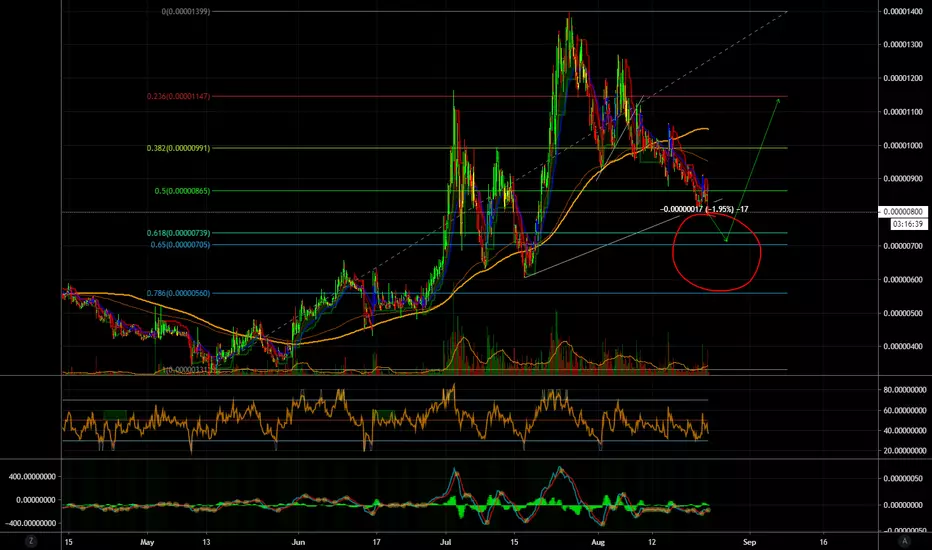
- RSI looking good and on favor of the bulls but we still need a cross over by the MACD lines and seems to be on the way though. EMA is still above the current price at around 877 sats and need to go further downward below the price for a confirmed call.
Note : For a confirmed and confident trading move we need to break the price level represented by the red circle on the chart. And Volume needs to continue to be flood in for a more bullish trend too.
Even though its looks a risky trade at the moment, using a strict stop loss and risk management we can have a good profit for the mid term.
Accumulation Price Area : 790 sats - 820 sats
Distribution Targets
Target 1 : 872 sats
Target 2 : 920 sats
Target 3 : 973 sats
Target 4 : 1055 sats
Mid Term Targets
Target 5 : 1137 sats
Target 6 : 1202 sats
Target 7 : 1254 sats
Target 8 : 1402 sats+
Stop Loss : 681 sats
Capital Accumulation : 3%
Risk : High
@Togetherweaccumulate

Potential Buy Zone REN BTCAfter broke the trendline, price is approaching to 0.382 fibonacci level. If can stay above of this level i'll label it as wave 2 just before huge wave 3.
If can not stay on this level, next support can be considered as 0.236 fib level.


REN/BTC (4H) The Price Broke down Current Dynamic Support. The price broke down current dynamic support. Right now next zone, where it's gonna be interesting to buy it is around 0.2 fibo level and main uptrend. Zones of interest and targets are on the chart. Good luck everyone!
DISCLAIMER:
This is just my opinion and view of the market. Please keep this in mind and consider in your trades.
Hit "Like" if you like my analysis. That would help me to understand if you really liked it :-) !
Trading ideas are not trading recommendations - this is just my point of view. You can agree or disagree with it.
Your likes and comments really help me. So I thank everyone in advance who really does it!
Subscribe if you would like to get my fresh updates on the market and my TA on a regular basis.
Good luck everyone!

REN/BTC POTENTIAL CYPHER PATTERN AX retraced 0.618
extension of AX is on 1.27
XC should retrace to 0.786
BUY 560
REN is extremely bullish could still pump a lot more. In terms of Elliot wave theory this could be wave one
Trade smart ND GET READY FOR Q4


REN - Support soon?This green box was before a strong resistance zone. Then it became a support zone, it has been tested twice. If it touches this support and holds then I will long REN.

130% Price Spike IncomingThis REN setup looks incredible right now. This support line has been tested 3 times in since late May. Each time price has touched the line or come very close, price has spiked 95%/143%/131%. A lot more people know about $REN now and are aware of its pumping ability. 130% price target from here is more than reasonable. If history repeats itself. 812 sats is a big resistance. If we can break that, we should be good for a reversal. We have 18 days until Binancne bans US users from trading. This could be the catalyst the $REN needs to get one last pump in before US customers are shut out.
*This is not financial advice. I am not responsible for any losses of money.*

RENBTC breakoutwell see volume almost lost and half about 350 btc so selling or the stop loss hunt is over all done in this coin if this is pure manipulation than maybe partnership or big pump is nearby.
it close above that black line which is there for this coin and done a great job if close above the last chart 4 hr trend line than it is unstoppable

REN Approaching Buy territoryRen trend is still bullish, approaching the %61.8 Fib retracement. Buying at 792 sats, with a stop loss at 749 if we break downward.
The RSI is near 40, about as low as it has been since the uptrend started.
This is not investment advice
Happy Punting!

REN - take 2Ok let's be honest sometimes fibs are very scary. Yesterday a perfect bounce on the .786 fib level. IMO here we have some solid horizontal support. If this hold then I am bias enough to long REN. I


REN in Falling Wedge - LONGI have here enough reasons to long REN.
Target is 1100 sat.
I will go out of the trade if there is a close below the EMA.
In this current market it is smart to move SL to Entry or nearby entry once the asset is going up.
Like and follow if you want to see more setups.

Ren - BearishIt's getting ugly up in here. I would slowly buy in between 730 and 776 sats (blue box), where support is. Until then we are still continuing to descend down. Even with the buy, we still need to see if there is convincing breakout (with volume). Stay tuned.

RENBTC Watch this trend lineVolume is almost 3x from 200 bitcoin to 600 but
Q )When to enter Trade
Ans ) ---just wait for 4hr to close above 350 and than another candle to wait after that you can decide to enter or not ..
just wait it gives you huge profit risk taker can enter now with sl 800 ( never hit i think )
i am a risk taker .. Happy Trading
