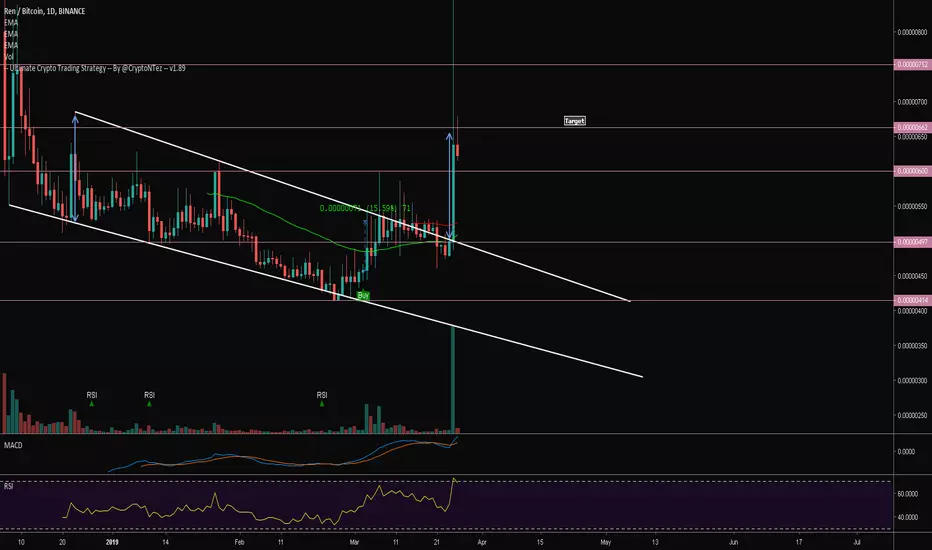
$REN Trying to break from descending channel(Target already met)Bringing the content from twitter, by the time Tradingview allowed me to upload, it was alread met. 30% in less than 24hs!
UCTS buy signal on 1D (15%+)
Volume starting to rise
MACD (about to bullcross) & RSI rising
Crossing ichi cloud
EMA50 as support, EMA100 as trigger
Falling below ~497sats should be a warning /potential targets on the chart.
#REN
RENBTC trade ideas
Educational video about shitcoin trading on many topicsIn this video I go through:
How to choose your exchange you buy a coin (differences between exchanges)
How to set your sell orders depending on the exchange you are on
Optimal exits (orderbooks + TA)
How to avoid your target not getting hit
How to learn faster
How to keep yourself in check when trading
Opportunity cost
When to get out and buy another coin
Why it isn't worth buying a coin that is up 200% right now
And more! All with examples of my mistakes (for which I will provide proof on twitter) explaining what went wrong.

REN/BTC poteantial breackout!REN is looking for potential breakout! we have possible reversal head and shoulders pattern. But to confirm that we need break the resistance neckline. Possible targets on the chart.

REN/BTC update WarZONEaproaching a pretyy big oporrunity.
good project
good FA
undervalued 10mm mcap
swimg trade , hold bag

RenBtc Potential Buy opportunity with 50-100% ProfitRenBtc breakout from falling wedge with potentail Inverse head and shoulder pattern.
Kindly follow the suggested buy zone on the chart and always remember to apply stop loss.
Level to watch for are:
POSSIBLE ENTRY ZONE
Possible Support LEVEL
SELL TARGETS
Do know that I appreciate you taking the time to read my posts and Please leave a LIKE and FOLLOW us for more updates.
Thank you

Hold it for now... but stay alert =)Chart completed a bearish ABCD and its doing a pullback after a 30% run up.
Retesting EMA100 is possible and a potential good entry if volume keeps pushing up.
Candles start looking as a ascending broadening wedge so stay alert for a break to the downside(SL).


RENBTC when to get inThis altcoin has a lot of hype and fewer bagholders since it is very new. Pump potential is high but not the time to buy until april.


Ren - highest daily volume in 3 monthsLooking for entry on Ren in green area, targets in orange.
Daily squeeze is looking good with momentum up + good volume.

Ren (RENBTC) A Hidden Gem? Ren (REN) Overview
Unstoppable Privacy
Transfer tokens in zero-knowledge, trustlessly swap between blockchains, trade on a dark pool, build any privacy preserving application. Never reveal anything.
Ren (RENBTC) Chart Analysis
Privacy altcoins/token are pretty famous within the cryptocurrency community, and that's because we beautiful and smart people love privacy but this is not why I am sharing it, as you might know already, I focus mainly on TA (technical analysis), so let's look at the chart and see what we've got.
12H Chart:
Looking at the chart above, I couldn't fail to notice how well the 0.00000444 level has been holding RENBTC price.
Now, this isn't enough to signal an upcoming bullish move, as a support can become weaker each time that it is tested, but in this case, we also have bullish divergence on the MACD and RSI, which tells me that a bounce might be coming.
This is also a low volume token on Binance, which is another strange find.
Very likely close to the bottom, low volume, privacy coin, and bullish divergence; now these are enough signals to pick my interest.
On the daily time frame we have a falling wedge pattern, which is bullish, as well as a bullish crossover on the MACD.
The weekly time frame is showing a double bottom.
This might be a good one in the future...
BLESSINGS FROM THE MOON
The moon shines bright, when it is high in the sky.
The moon might seem strange, it has a role to play.
Again, it's strange, but you are out today.
You might not know, yet your body moves alone.
Feelings are running high, emotions come to the front.
You wonder what is happening...
The FULL MOON today is ON!
Namaste.


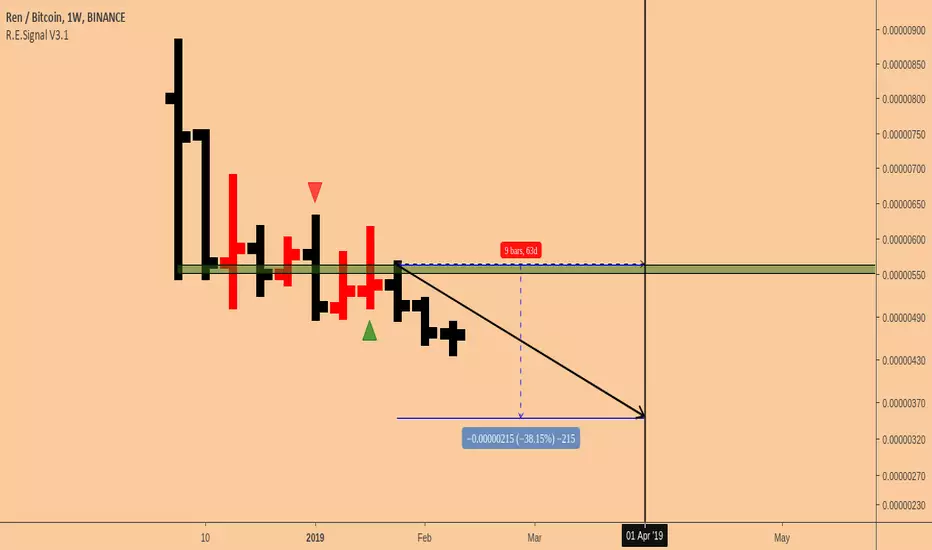
IS REN STRUCTURING FALLING WEDGE?All lines parallel to each other. I don't know why but I observe with different altcoins, 28 Feb - 1 Mar there would be big positive movement on bitcoin or altcoin market. I'm waiting big dump on bitcoin and also REN. This my scenario:
-BTC will rose up to 4200$, it will cause big down in altcoin market and REN will drop to 440 level
-After that, BTC will oscillate 4000$ level and altcoin market will rose up and REN will reach 500 level
-BTC will start to down from 4000$ to 1800-2000$ level, and market will fall too much and REN will move down 414 level
and from this point the real bull will start
We will see :)

REN BTC WOLF PATTERN - 3 basamak formasyonu ile %30REN BTC WOLF PATTERN - 3 basamak formasyonu ile %30


REN-BTC Long Trade PlanREPUBLIC PROTOCOL LONG TRADE
Chart is self explanatory I think.
Shorting zone is mentioned along with Stop Loss and TP Price Points.

REN is a buyI see a rounded bottom continuing to play out, with nice spikes here and there.
StochRSI is curling up signaling a buy. Manage your risk since it is not at lower BB yet (547) and volume isn't there just yet. I plan to start entering in, and will readd if we hit 540s.
Stop loss at 530 level.
With "dark pools" as staking at 100,000 REN and a low market cap, this could pump through 2019

REN rounded bottomSimple chart here. I see REN rounding out its bottom with a few nice pumps as it bounces off support.
Stoch RSI shows its a good time to rebuy for another leg up.
Don't go all in, manage your risk. BB shows 547ish could catch it if theres a dump. That's a readd, buy the dip zone for me. Stop loss at 530.
With "dark pools", staking at 100,000 REN and a low market cap, I think it's good to park a little BTC here for the long term

Falling Wedge pattern over? Watch out? Idea :P (10%)I think we got a broke falling wedge, which means its probably gonna go up in the next days BUT probably will touch 56.


Republic Protocol (RENBTC) Quick Analysis by RequestRENBTC is looking good but with mixed signals.
It is looking to breakout soon... Lower highs and higher lows... Volume decreasing and price volatility being reduced.
If RENBTC breaks down, you can expect to find support around the green zone. This is where support is found.
If RENBTC breaks up, resistance can be found around the red zone. That is our main resistance.
Additional sideways action is possible.
This is not a set up that I like. I wouldn't trade here because of the little info provided by the chart, and the fact that there is a good chance of this triangle breaking down.
Another way to trade is after breakout. With a strong close above MA99 (red line), is a bullish signal.
Here is the daily chart:
Note: This is no trade advise. This is an analysis by request.
Thanks a lot for reading.
Make sure to hit LIKE. :)
Namaste.
