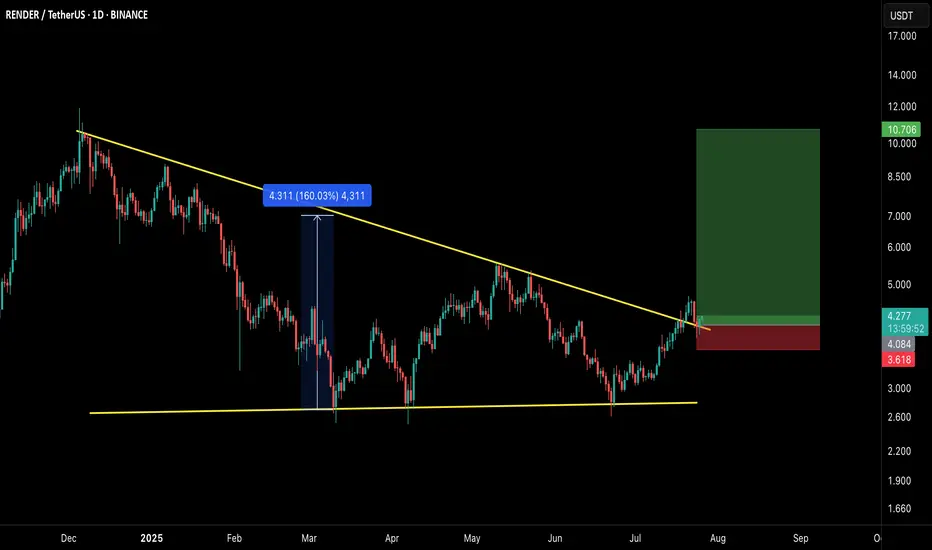
$RNDR/USDT – Breakout Setup Alert!RNDR has officially broken out of the long-standing descending trendline, confirming a bullish reversal structure. This breakout comes after a sustained consolidation phase and successful retest, indicating strength in buyer momentum.
🔍 Technical Breakdown:
Descending triangle breakout confirmed
Pr
Related pairs
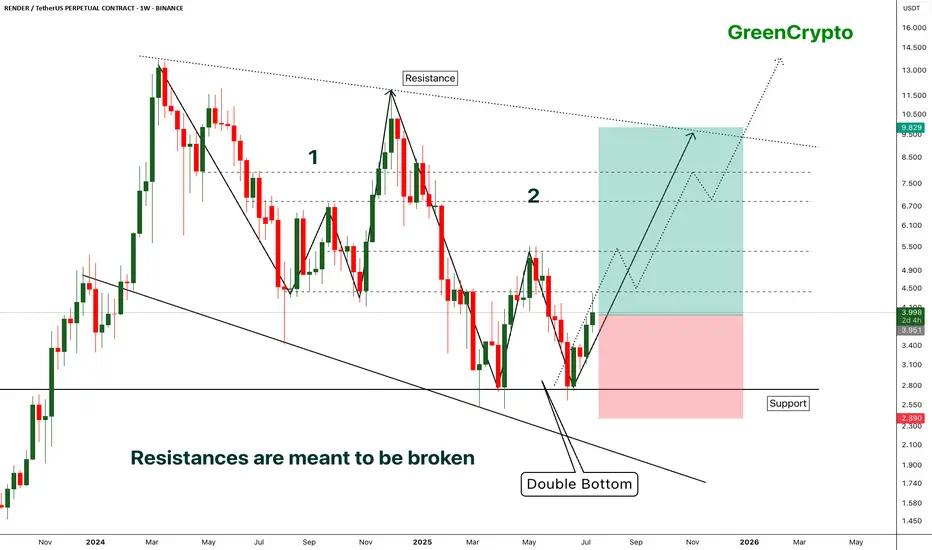
RENDER - [Double bottom] - Resistances are meant to be broken- RENDER has successfully bounced back from the support by forming the double bottom pattern.
- Double bottom pattern is bullish pattern, when it forms at the strong support it becomes extremely bullish. this is one of such scenario.
- Im expecting some minor resistance at the local resistance ar
RENDER – Clean Breakout Sets the Stage for Next MoveCRYPTOCAP:RENDER is showing a smooth and confident breakout from the descending trendline on the daily chart 📈. After testing the resistance zone, price is now holding above it—signaling control by the bulls 🟢.
What stands out is the calm, steady pace of this move—no sudden spikes, just consistent

Crypto market review [UPD]: set-ups in BTC and alt-coinsMade a quick video going over some of the setups I see developing in Bitcoin and a few altcoins I personally track and trade.
Thank you for your attention and I wish you successful trading decisions!
If you’d like to hear my take on any other coin you’re following — feel free to ask in the comment

Render | $$$ | Target: 5.50This technical analysis is for informational and educational purposes only. It does not constitute financial advice. Remember to always research and consult with a professional before making investment decisions. Good luck! 📈💼🚀

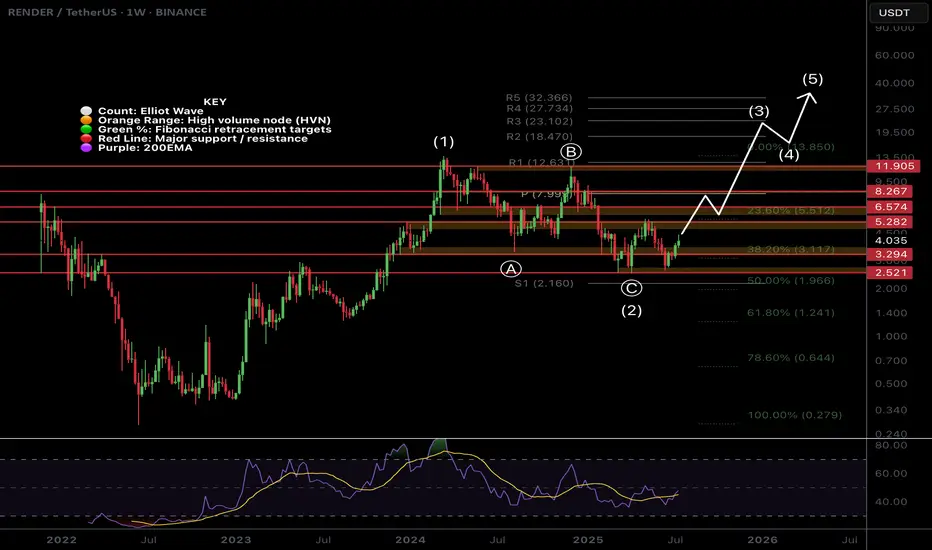
Clear Path Toward a New ATH👉 Easy and simple setup, as a Elliot view, we are facing a complete impulse and also wave 4 completed with a nice abc pattern and perfectly bounced from 1.272% level, expect a new bullish rally from here toward a 7.3$, 9.5$ And 21$ as a new ATH

$RENDER Weekly Brings Clarity!CRYPTOCAP:RENDER weekly chart shows long term strength through the depth of the Fibonacci retracement not even reaching 0.5.
The depth of the recent swing low been so close wave (C) does concern me that the larger correction is not yet over and maybe price does want to visit the 'alt-coin' golden
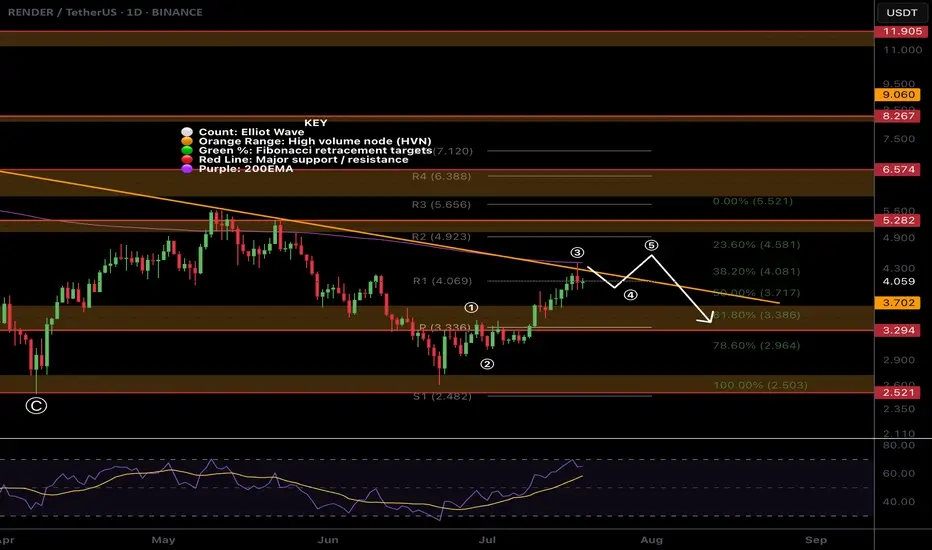
$RENDER At Major Resistance!CRYPTOCAP:RENDER has been relatively weak. Looking at the local chart it appears we have finished a wave (3) at the daily 200EMA and descending resistance.
Price has overcome the High Volume Node (HVN) support flipped resistance but a strong at coin pull could see fresh lows for Render.
There is
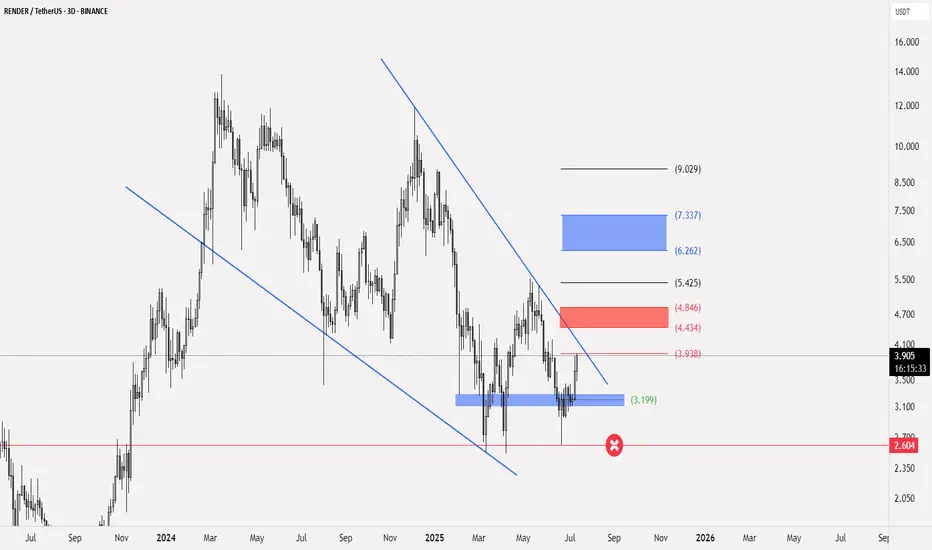
RENDER trading planCRYPTOCAP:RENDER
⭕️ Entry is possible from the current price of 3.9 and strengthened at 3.19
🚨 The stop loss for this model is at 2.604
📄 The actual upward signal is breaking above 3.938 on a three-day frame
💵 Targets: range 4.434 - 4.846 and range 6.262 - 7.337
RENDERUSDT 1D#RENDER has broken above the descending trendline and the Ichimoku Cloud on the daily chart. It has also broken above the daily SMA200, though the daily candle has not yet closed. In case of a successful retest of the trendline and confirmation of the breakout above the SMA200, the targets are:
🎯 $

See all ideas
Summarizing what the indicators are suggesting.
Oscillators
Neutral
SellBuy
Strong sellStrong buy
Strong sellSellNeutralBuyStrong buy
Oscillators
Neutral
SellBuy
Strong sellStrong buy
Strong sellSellNeutralBuyStrong buy
Summary
Neutral
SellBuy
Strong sellStrong buy
Strong sellSellNeutralBuyStrong buy
Summary
Neutral
SellBuy
Strong sellStrong buy
Strong sellSellNeutralBuyStrong buy
Summary
Neutral
SellBuy
Strong sellStrong buy
Strong sellSellNeutralBuyStrong buy
Moving Averages
Neutral
SellBuy
Strong sellStrong buy
Strong sellSellNeutralBuyStrong buy
Moving Averages
Neutral
SellBuy
Strong sellStrong buy
Strong sellSellNeutralBuyStrong buy
Displays a symbol's price movements over previous years to identify recurring trends.
Frequently Asked Questions
The current price of RENDER / TetherUS (RENDER) is 4.326 USDT — it has risen 0.78% in the past 24 hours. Try placing this info into the context by checking out what coins are also gaining and losing at the moment and seeing RENDER price chart.
RENDER / TetherUS price has risen by 1.92% over the last week, its month performance shows a 42.52% increase, and as for the last year, RENDER / TetherUS has decreased by −36.13%. See more dynamics on RENDER price chart.
Keep track of coins' changes with our Crypto Coins Heatmap.
Keep track of coins' changes with our Crypto Coins Heatmap.
RENDER / TetherUS (RENDER) reached its highest price on Mar 17, 2024 — it amounted to 13.838 USDT. Find more insights on the RENDER price chart.
See the list of crypto gainers and choose what best fits your strategy.
See the list of crypto gainers and choose what best fits your strategy.
RENDER / TetherUS (RENDER) reached the lowest price of 0.274 USDT on Jun 18, 2022. View more RENDER / TetherUS dynamics on the price chart.
See the list of crypto losers to find unexpected opportunities.
See the list of crypto losers to find unexpected opportunities.
The safest choice when buying RENDER is to go to a well-known crypto exchange. Some of the popular names are Binance, Coinbase, Kraken. But you'll have to find a reliable broker and create an account first. You can trade RENDER right from TradingView charts — just choose a broker and connect to your account.
Crypto markets are famous for their volatility, so one should study all the available stats before adding crypto assets to their portfolio. Very often it's technical analysis that comes in handy. We prepared technical ratings for RENDER / TetherUS (RENDER): today its technical analysis shows the buy signal, and according to the 1 week rating RENDER shows the neutral signal. And you'd better dig deeper and study 1 month rating too — it's sell. Find inspiration in RENDER / TetherUS trading ideas and keep track of what's moving crypto markets with our crypto news feed.
RENDER / TetherUS (RENDER) is just as reliable as any other crypto asset — this corner of the world market is highly volatile. Today, for instance, RENDER / TetherUS is estimated as 3.12% volatile. The only thing it means is that you must prepare and examine all available information before making a decision. And if you're not sure about RENDER / TetherUS, you can find more inspiration in our curated watchlists.
You can discuss RENDER / TetherUS (RENDER) with other users in our public chats, Minds or in the comments to Ideas.