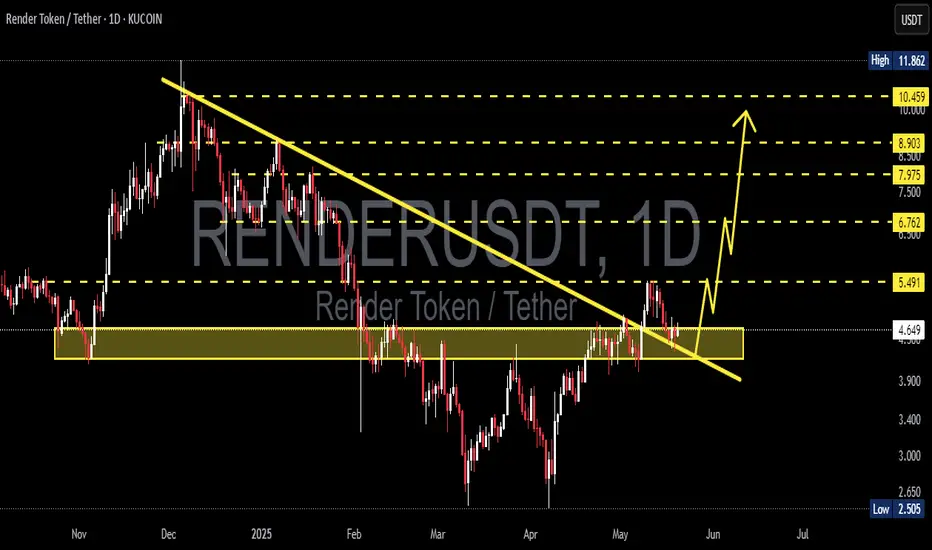
RENDERUSDT 1D AnalysisRENDER ~ 1D Analysis
#RENDER Buy back gradually from this support block with short term target of at least 15%+ , Long term target $11
RENDERUSDT trade ideas

RENDER Is $1.366 the Next Stop Before a Major Market Reversal?Yello Paradisers! Are you prepared for the drop that could clean out both bulls and bears before the real move begins? Or will you be caught in another trap?
💎#RENDERUSDT has broken down from its ascending channel. This confirms that bullish momentum has faded, and the structure no longer supports higher prices.
💎The price is now trading below both the 50 EMA and 200 EMA on the daily timeframe. These are key trend indicators. Losing them shifts the bias to the downside. After rejection from the $5.00–$5.40 supply zone, the market failed to make a new high. That area remains strong resistance. Bulls must reclaim it to regain control.
💎Previous support around $4.00 has now turned into resistance. As long as price stays below this zone, lower targets remain in play.The next support is around $2.46, but that may only offer temporary relief. The real demand zone sits near $1.366, where stronger buying interest is expected.
💎Tether dominance (USDT.D) is showing early signs of risk-off behavior. It has reclaimed the 21, 50, and is now testing the 200 EMA at 4.88%. This suggests capital is rotating out of altcoins and into stablecoins.This shift is backed by rising volume. It's not retail noise it’s institutional positioning. The market is preparing for a deeper correction.
Stay disciplined. The next big opportunity will come to those who wait not those who chase.
MyCryptoParadise
iFeel the success🌴

RENDER Potential Bullish Breakout OpportunityRENDER seems to exhibit signs of overall potential Bullish momentum if the price action forms a prominent Higher High with multiple confluences through key Fibonacci and Support levels which presents us with a potential long opportunity.
Trade Plan:
Entry : 5.8
Stop Loss : 2.2
TP 1 : 9.4

RNDR (Render) – Higher Low Setup for Potential Upside ExpansionRENDER is holding strong above the $3.50–$4.00 support zone, forming what appears to be a higher low — a classic sign of potential trend continuation. This setup provides a favorable risk-to-reward ratio with clearly defined invalidation and upside targets.
📥 Entry Zone:
$3.50 – $4.00
🔸 Holding above demand
🔸 Prior resistance now acting as support
🔸 Potential higher low setup
🎯 Take Profit Targets:
🥇 $6.00 – Previous local top / liquidity pocket
🥈 $8.00 – Major resistance zone from prior cycle
🥉 $10.00 – Psychological round number + HTF extension target
🛑 Stop Loss:
Daily close below $2.50
Clears invalidation of the structure
Below HTF support base


Render – Re-Entry Opportunity After Hitting First TargetRENDER hit the first take profit target (TP1) with a ~52% gain — great execution. Now, after the expected pullback, price is approaching a key support zone, offering a second swing trade opportunity.
🔹 Entry Zone:
Around $4.00 support
🔁 Previous resistance turned support
🧭 Psychological level and structural base
🎯 Take Profit Targets:
🥇 $4.80 (recent local high / resistance)
🥈 $5.40 (next significant supply zone)
🛑 Stop Loss:
$3.69 (below key support & invalidation level)

#RENDER/USDT#RENDER
The price is moving within a descending channel on the 1-hour frame, adhering well to it, and is heading for a strong breakout and retest.
We are experiencing a rebound from the lower boundary of the descending channel, which is support at 4.20.
We are experiencing a downtrend on the RSI indicator that is about to break and retest, supporting the upward trend.
We are looking for stability above the 100 Moving Average.
Entry price: 4.41
First target: 4.60
Second target: 4.78
Third target: 4.98

#RENDER/USDT#RENDER
The price is moving in a descending channel on the 1-hour frame and is expected to continue upwards
We have a trend to stabilize above the moving average 100 again
We have a descending trend on the RSI indicator that supports the rise by breaking it upwards
We have a support area at the lower limit of the channel at a price of 3.55
Entry price 3.75
First target 3.92
Second target 4.14
Third target 4.40

RENDER is undervalued and in a downtrendRENDER is still in a downtrend, with lower highs and lower lows. More importantly, the current misunderstanding of Coinbase delisting is causing the price to fall more than expected. Is the oversold state an opportunity?
Full TA: Link in the BIO

RENDERUSDT likely to head towards 7 and beyondThis one looks very promising.
The price is trading between weekly resistance WR1 and weekly support WS1.
The price may hit WS1 again before making a bounce and aiming for WR1.
With resistance facing some pullback at WR1, it is likely to attempt that resistance again only to break it this time and continue its journey to further upward.
Very nice long opportunity from WS1 zone.
I am loading this one heavy on WS1 hit.

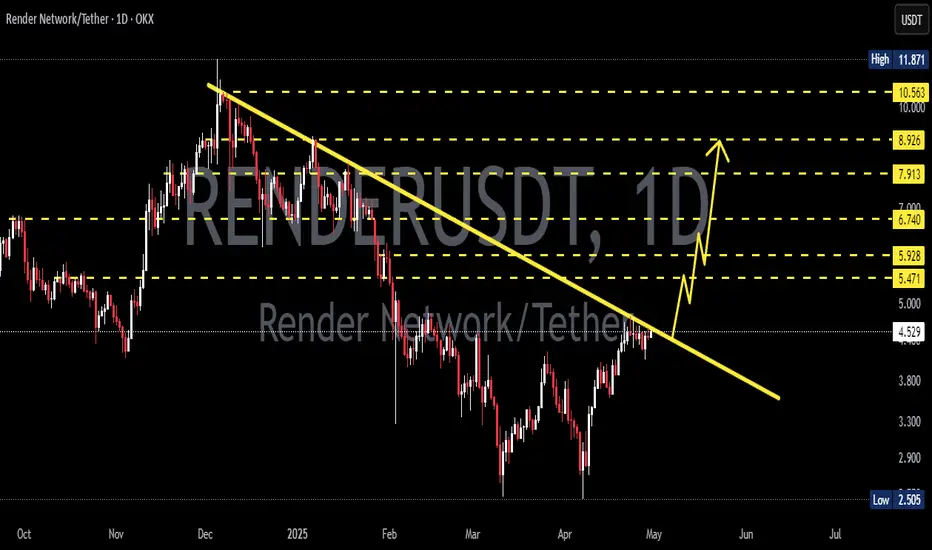
RENDERUSDT 1D Analysis RENDER ~ 1D Analysis
#RENDER Buy gradually from here if you still have confidence in this coin with a short term target of at least 10%++ from here.
RENDER your thoughts, NOW!Hello - Below is the Market Profile for - RENDER
FET/USDT continues to display strong bullish structure on the 4H chart, as confirmed by successive POC shifts and value areas migrating upward. After consolidating between $0.72 and $0.78 with overlapping value, the price broke out and formed a clear demand zone around $0.78–$0.80, which was respected on the next session’s pullback. Volume has built up heavily around $0.84–$0.86, forming a balanced node which is now acting as a fresh value area. The current candle is printing above the POC, indicating buyers are still in control. As long as FET holds above $0.86, the bias remains long, with potential upside targets of $0.90 and $0.93. A breakdown below $0.84 would indicate rotation back into the previous volume pocket, making $0.80 the next demand zone to watch. Overall, structure is strong and favors buying dips rather than chasing highs.
My doodle is also very straightforward lol, wait for dips!

RENDER Breakout AlertSuccessfully breakout this resistant line with a short -term target of at least 10%+.

RENDERUSDT 1D AnalysisRENDER ~ 1D Analysis
#RENDER Buy after successfully penetrating this resistant line with a short -term target of at least 10%+ from here.
RENDER Testing Red Resistance Zone🚨 RENDER Testing Red Resistance Zone 🚨
RENDER is currently testing a significant red resistance zone. A breakout above this level could signal a bullish move, with the target set at the green line level.
📈 Technical Overview:
Resistance Zone: Red area currently being tested.
🎯 Breakout Target: Green line level upon confirmation.
TradeCityPro | RENDER: AI Token at Breakout or Breakdown Point👋 Welcome to TradeCity Pro!
In this analysis, I want to review the RENDER coin for you. This project is one of the crypto AI projects that gained a lot of hype after AI projects started trending.
🔍 The coin of this project currently has a market cap of $2.36 billion and ranks 45th on CoinMarketCap. Let’s move on to the analysis to see the technical condition of this coin.
📅 Daily Timeframe
As you can see in the daily timeframe, after the drop shown in the chart, with the price falling to the 2.774 area, a ranging structure has formed, and the top of this box is at the 4.52 level.
⭐ Currently, the price has reached the top of the box and is interacting with this level. If the box top is broken, the main bullish trend can begin, and the price may move toward the 6.682 area.
🎲 If this happens, pay attention to the volume, because the volume should increase alongside the price movement and be in convergence. If a large buying volume enters the market, the probability of this scenario increases.
📈 So for spot buying or opening a long position, you can enter on the breakout of 4.520.
🔽 To confirm the market turning bearish, we need to confirm the end of the current bullish leg. If the price gets rejected from the box top or if a fake breakout happens, a break of 4.119 confirms the rejection, and in that case, the price can move back down to the box bottom.
💥 The support levels ahead for the price are 3.513 and 2.774, which can be used as targets for short positions.
📊 The main trigger for the beginning of the next bearish leg is the 2.774 area. If this level is broken, the price will likely make a sharp downward move.
📝 Final Thoughts
This analysis reflects our opinions and is not financial advice.
Share your thoughts in the comments, and don’t forget to share this analysis with your friends! ❤️

RENDER/USDT:BUY Hello friends
Given the price growth we had, a range has now been created in the price correction, which indicates the strength of the trend, so we can enter the trade.
The purchase and target points have also been identified...
Follow capital management.
*Trade safely with us*

Render on Top !this mega altseason could be AI season so AI tockens which is located to US are more profitable
dont forget its not financial advice its my analysis about this chart

Render is dumping Well, as you can see, the render has hit its daily resistance and broken the 4-hour uptrend from below and can go down to the daily support area. The first target is around 2.7 and the second target is the support area of $1.
This is not an investment offer or a buy or sell signal. This is simply my personal opinion. Please check it yourself and observe capital and risk management.

RENDER/USDT Technical Analysis:
FIB Level to watch: Measured from swing high $6.116 to low $2.476, we have the following retracement zones:
Level
Price
0.236
$3.335
0.382
$3.866
0.5
$4.296
0.618
$4.726
0.786
$5.138
RSI (14): Bullish but Not Overheated
Current RSI: 47
RSI(Daily) - 61
Recent High: 66.11
Interpretation: Momentum is strong but not yet overbought, offering room for continued upside. A breakout above 70 could signal short-term overheating, though it may also confirm trend strength.
Summary Outlook: Eyes on $4.72 Breakout
RENDER is riding a bullish wave with price action reclaiming major Fib levels and RSI pointing up. The $4.72 resistance (Fib 0.618) is the most important level to break for sustained upside. If bulls succeed, targets between $5.13 and $5.75 come into play.
Indicator
Support
Resistance
RSI(4h)
44.00
70.00
RSI(daily)
60
Fib 0.5
$4.296
$4.726 (0.618)
Fib 0.786
—
$5.138

Render Is Ready, Bottom Confirmed (340% Easy Target)Render Token is super ready right now and the correction bottom is now confirmed. Notice this pattern on the chart. There are two lows and then a move back above support.
The current candle is the bullish signal. After trading lower, it is now at the upper end of the session, trading near the session high. This high is higher than the previous session open and the close of the one preceding it, the full green candle.
After the main low there were two strong green sessions. Followed by one red session and the current session moving lower, meaning bearish action. This bearish action is being negated and once this session closes green, we have a very strong bullish signal with the bottom confirmed. This will be the start of the next bull market phase.
There will be long-term growth. RENDERUSDT can grow much more than the 340% shown on the chart. It will definitely go much higher, this target is for the mid-term, within 3 months. It will start to grow now, in the coming days and weeks and everything will speed up. This target will hit but no big deal, there will be more.
Expect a correction between now and the final bull market bull-run. The correction can last three weeks just as it can last 2 full months or more. We will have a better idea when the bull market starts to develop. It is still very early but also very close. We have only a few weeks before the entire Cryptocurrency market turns green.
Namaste.

Render getting ready for a reversal? RNDR price action got strong support twice at a good inflection point. Momentum and trend oscillators are diverging and in the bullish control zone. Market structure may confirm a choch.
Full TA: Link in the BIO

RENDERUSDT 1D#RENDER has broken the trendline and the MA50 to the upside on the daily timeframe. Currently made a double bottom pattern which is very promising. Buy and hold. Targets:
🎯 $4.527
🎯 $5.779
🎯 $6.791
🎯 $7.803
🎯 $9.243
Use a tight stop-loss.
