RENDERUSDT Possible Senario, Bottom Head & ShoulderRENDERUSDT Possible Senario, Bottom Head & Shoulder
RENDERUSDT trade ideas

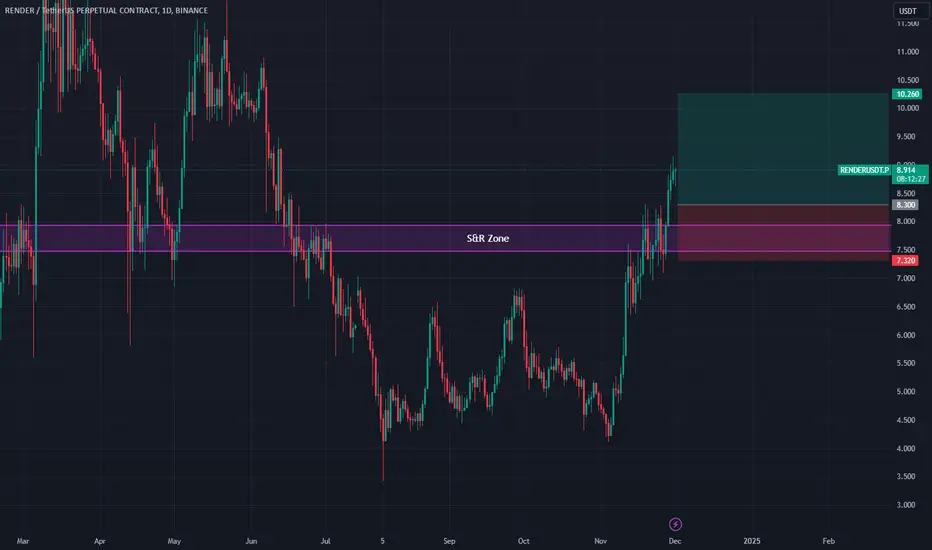
RENDER Update - 11.12.2024 / Long setup We are forming an ascending ouf on the daily, there is an open target in the form of ATH.
I plan to work on the lower tf in the long direction!
Observe risks and think with your head!

RENDER Buy Opportunity: Blue Box as Key ZoneThere’s a possibility that the cryptocurrency market may not fully recover by the end of the year. In response to this uncertainty, I’ve adjusted my buy positions downward to align with a more cautious approach.
For RENDER, the blue box represents a critical buy zone, reflecting a strong support level. I plan to join as a buyer in this area, anticipating a favorable risk-reward setup.
Key Levels:
Blue Box: Potential entry zone
Stop Loss: 3.5$
Target: Monitor for a bounce with strength confirmation
Patience is key in these market conditions. Let the setup come to you!
This is not financial advice.
I keep my charts clean and simple because I believe clarity leads to better decisions.
My approach is built on years of experience and a solid track record. I don’t claim to know it all, but I’m confident in my ability to spot high-probability setups.
My Previous Analysis
🐶 DOGEUSDT.P: Next Move
🎨 RENDERUSDT.P: Opportunity of the Month
💎 ETHUSDT.P: Where to Retrace
🟢 BNBUSDT.P: Potential Surge
📊 BTC Dominance: Reaction Zone
🌊 WAVESUSDT.P: Demand Zone Potential
🟣 UNIUSDT.P: Long-Term Trade
🔵 XRPUSDT.P: Entry Zones
🔗 LINKUSDT.P: Follow The River
📈 BTCUSDT.P: Two Key Demand Zones
🟩 POLUSDT: Bullish Momentum
🌟 PENDLEUSDT: Where Opportunity Meets Precision
🔥 BTCUSDT.P: Liquidation of Highly Leveraged Longs
🌊 SOLUSDT.P: SOL's Dip - Your Opportunity
🐸 1000PEPEUSDT.P: Prime Bounce Zone Unlocked
🚀 ETHUSDT.P: Set to Explode - Don't Miss This Game Changer
🤖 IQUSDT: Smart Plan
⚡️ PONDUSDT: A Trade Not Taken Is Better Than a Losing One
💼 STMXUSDT: 2 Buying Areas

#RENDE(SPOT) entry range( 4.45- 5.45) T.(10.299) SL(4.439)BINANCE:RENDERUSDT
entry range ( 4.45- 5.45)
Target (10.299)
SL .1D close below (4.439)
*** collect the coin slowly in the entry range ***
*** No FOMO - No Rush , it is a long journey ***
**** #Manta ,#OMNI, #DYM, #AI, #IO, #XAI , #ACE #NFP #RAD #WLD #ORDI #BLUR #SUI #Voxel #AEVO #VITE #APE #RDNT #FLUX #NMR #VANRY #TRB #HBAR #DGB #XEC #ERN #ALT #IO #ACA #HIVE #ASTR #ARDR #PIXEL #LTO #AERGO #SCRT #ATA #HOOK #FLOW #KSM #HFT #MINA #DATA #SC #JOE #RDNT #IQ #CFX #BICO #CTSI #KMD #FXS #DEGO #FORTH # AST #PORTAL #CYBER #RIF #ENJ #ZIL #APT #GALA #STEEM #ONE #LINK #NTRN #COTI #RENDER ****

RENDER goes BooOooOooM!?RENDER spiked up for news looks weak to me, Shorts at cmp for targets till 6.636 deep and 7.348 for shorts targets, Invalid above tops high 11.895 as SL's Quick and risk free trades.
I know alt season memes season, for me it looks bit compulsive

RENDER "played well" and "paid well"3 entries and 3 profits booked with RENDER 🤑
It was a good channel to trade to, I was just observing the OBs and hit LONG at the support level waiting for the breakout.
I guess we'll see on the new ATH? Who knows.

RENDER | HOW TO GET IN ?I initially entered SEED_DONKEYDAN_MARKET_CAP:RNDR positions around the $5 level, anticipating a strong move. With the market positioning itself for another potential breakout, SEED_DONKEYDAN_MARKET_CAP:RNDR is at a critical juncture.
The price is currently testing a significant resistance zone, and a clean break above this level could signal the next explosive move. Traders can look to board the train once this resistance is breached and confirmed, aligning with the broader bullish momentum in the market.
I keep my charts clean and simple because I believe clarity leads to better decisions. Trading doesn’t have to be overly complicated, and I enjoy sharing setups that have worked well for me.
My approach is built on years of experience and a solid track record. I don’t claim to know it all, but I’m confident in my ability to spot high-probability setups. It’s all about learning and growing together as traders, and I’m here to share what I see.
The markets can confirm what the charts whisper if we’re paying attention. I hope these levels help you as much as they’ve helped me in the past. Let’s see how this plays out!
My Previous Analysis
🐶 DOGEUSDT.P: Next Move
🎨 RENDERUSDT.P: Opportunity of the Month
💎 ETHUSDT.P: Where to Retrace
🟢 BNBUSDT.P: Potential Surge
📊 BTC Dominance: Reaction Zone
🌊 WAVESUSDT.P: Demand Zone Potential
🟣 UNIUSDT.P: Long-Term Trade
🔵 XRPUSDT.P: Entry Zones
🔗 LINKUSDT.P: Follow The River
📈 BTCUSDT.P: Two Key Demand Zones
🟩 POLUSDT: Bullish Momentum

Render swing long 1:2 R:RA simple swing long idea on Render. I set a limit order with 2% risk. Let´s see how it goes.
DISCLAIMER: I am not providing trading signals or financial advice. The information shared here is solely for my own documentation and to demonstrate my trading journey. By openly sharing my process, I aim to put pressure on myself to stay focused and continually improve as a trader. If you choose to act on any of this information, you do so at your own risk, and I will not be held responsible for any outcomes. Please conduct your own research and make informed decisions.
RENDER Coin Buy Trade Analysis and Future Movement ExpectationsHello, today's analysis is about BINANCE:RENDERUSDT.P . The trade will be a buy, and we expect the currency to continue its upward movement. However, if the price reaches the 4H line, in this case, we will wait for the price to return to our entry zone before closing the trade.
If the price closes above the TP1 line, we expect it to continue rising toward TP2.


TradeCityPro | RENDERUSDT Analysis Continued Uptrend?👋 Welcome to the TradeCityPro channel!
Let’s analyze RENDER, a popular crypto project in the graphics card and infrastructure domain, which also operates as a Layer 2 solution.
🌍 Bitcoin's Market Overview
As always, before diving into RENDER, we take a quick look at Bitcoin. According to prior analyses, the recent red candles are purely corrective and indicate no major trend reversal. Corrections are healthy for any uptrend. Bitcoin is showing renewed green candles, with a 4% rise today.
After breaking 94,859, you can open long positions. However, due to the decreasing Bitcoin dominance (BTC.D), this level can also be considered a confirmation for entering altcoins. A further wave of uptrend seems possible.
📊 Weekly Timeframe
RENDER is one of the most bullish altcoins, similar to SOL, SUI, and OM. It has experienced less decline compared to other altcoins, largely due to the hype around Layer 2 and NVIDIA, which boosted this coin before the bull run.
After its upward move and correction from 13.009, it hit the support at 4.405 and formed a green candle that engulfed the prior two candles. This alone serves as a bullish trigger in an uptrend. Currently, it has reached the key resistance level of 7.914.
If this resistance is broken, given the bullish structure in higher time frames and the formation of higher lows, the coin can continue its upward movement. A buy position with a stop loss at the 4.405 level is reasonable. RSI entering the overbought zone can confirm the bullish trend further. If missed, a trigger at 13.009 remains valid.
📈 Daily Timeframe
The primary resistance at 6.999 was broken, but no significant movement occurred afterward. For now, we consider 8.023 as a key trigger level. After its breakout, the price can aim for targets at 9.765 and 11.240.
Additionally, the main resistance level of 13.009 in the higher time frame is adjusted to 11.240 as the broader market has shown more logical reactions to this level.
RSI displays notable divergence, but during a bull run, it is often disregarded. Personally, I prefer taking positions with a stop loss rather than missing the potential movement.
⏱ 4-Hour Timeframe
After breaking 5.198, the coin experienced a solid uptrend. I opened a long position, and if the resistance at 8.094 is broken, I plan to move my stop loss to 6.532. Currently, the price is ranging between 7.18 and 8.09.
📈 Long Position Trigger:
Upon breaking 8.094, I will open another long position and follow the potential continuation. If the price approaches the resistance with strong momentum, I may also set a stop-buy order with a larger stop loss at 7.18.
📉 Short Position Trigger:
For now, no short setups are considered during the bullish trend. If 6.532 is broken, I might only close my long position.
💡 BTC Pair Insight
Compared to Bitcoin, RENDER remains bullish, bouncing strongly from support levels. Breaking its descending trendline reinforces the continuation of its uptrend.
For those needing a trigger, breaking 0.00010090 on its BTC pair confirms further moves, even though by then, its USDT pair may have already pumped 50%. The key movements often come after the trigger.
📝 Final Thoughts
Stay calm, trade wisely, and let's capture the market's best opportunities!
This analysis reflects our opinions and is not financial advice.
Share your thoughts in the comments, and don’t forget to share this analysis with your friends! ❤️


Render can easily go to $14. HTF order flow playRender can easily go to $14. I have a small position and want to add more. I m not buying just now when it made a 100% move. Most likely some pullback will come.
you are welcome to comment with your thoughts and share your charts or questions below, I like any constructive discussion.
What is CLS?
This company is trading for the biggest investment banks and central banks. They trade over 6.5 trillion daily volume. They are smart money of the all markets.
CLS operates in the specific times which will give you huge advantage and precisions to you entries. Focus on that. Its accuracy is amazing.
Good luck and I hope this educational post helps to become a better trader
“Adapt what is useful, reject what is useless, and add what is specifically your own.”
Dave FX Hunter ⚔

RENDER | Characteristic of a ConsolidationYou can jump in to the train anywhere below 0.5.
RENDER is completing this type of consolidation in this way, but if it loses here, I can also evaluate the lower regions as a purchase. I had previously purchased RENDER at an average of $5.5 and shared my analysis here.
If we go below $6.961 we might see a pullback till $6.330.
My Previous Ideas
DOGEUSDT.P | 4 Reward for 1 Risk much more if you hold it.
RENDERUSDT.P | HTF Accuracy
ETHUSDT.P | Accurate Buyer Zone Identification | High Risk Reward if you hold it.
BNBUSDT.P | Accurate Buyer Zone Identification | High Risk Reward if you hold it.
Bitcoin Dominance | Great Characteristic Detection and Accurate Analysis

#RENDER / Ready to go up#RENDER
The price is moving in a descending channel on the 12-hour frame and sticking to it well
We have a bounce from the lower limit of the descending channel, this support is at a price of 4.20
We have a downtrend, the RSI indicator is about to break, which supports the rise
We have a trend to stabilize above the moving average 100
Entry price 5.57
First target 6.43
Second target 7.31
Third target 8.18

$RENDER prepares for growthThere is already a consolidation above the 50 EMA, on a Fibonacci level I would expect a price around 1.618 ($20). Meta AI is starting, Render is one of the big projects in this area. I wish everyone good luck!
Horban Brothers.

double bottom on renderdouble bottom pattern is shown in the chart and neck line broke.
pullback completed
target is between 10 and 11. but we can go very much in bull run.....

RENDER USDT TO $14- Claimed 200 EMA and MA on daily
- Retested 200 MA on daily
- Claimed 0.382 FIB
- Broke weekly resistance
- Targets: 8.5, 10, 11.5, 14
- Should go much higher than $14 next year
- Super bullish on Render
- AI token with huge narrative and money behind it
- Dips are for buying
- Should really take of when btc.d falls off
Swing trade idea. Kindly follow targets. Will update with new targets once all 5 are achieved. Mostly trading with PNF charts, Fibs, MACD, RSI, Stoch, BPI, Cipher, MA/EMA,
Support/Resistance on hourly timeframes and higher time frames.
BINANCE:RENDERUSDT COINBASE:RNDRUSD BINANCE:RENDERUSDT.P COINBASE:RENDERUSD CRYPTO:RENDERUSD BYBIT:RENDERUSDT.P COINBASE:RNDRUSDT OKX:RENDERUSDT BYBIT:RENDERUSDT MEXC:RENDERUSDT.P BITGET:RENDERUSDT.P

RENDERRENDERUSD and RENDERBTC follow the same graph at the moment , however the USD one has broken above the bearish trendline that it had since the beginning of 2024. Once daddy ETH wakes up from it's slumber and pushes towards new highs , this will fly easily.
Obviously DYOR and take this info with grain of salt.

Clear Bullish Setup 👉 The Price Playing Below The Important Trend Line And The Exiting Point Is a Perfect Bull Flag Formed Exactly Formed Below This Trend Line, Expect a Breakout Toward a 8.3$ And 11.6$

RenderRENDER / USDT
Price is breaking out from falling wedge + also horizontal resistance
Looks bullish for me in med term

renderSupport and press the rocket to cheer me up
Observe the ten percent loss limit
Stay away from Bitcoins
Feel free to buy and sell and post your comments

New attempt on RenderI just caught the wick and entered Render long. Took some profit (TP1) already. Now hopefully it gets to TP 2, so I can move SL to BE and ride it risk-free with profits.
DISCLAIMER: I am not providing trading signals or financial advice. The information shared here is solely for my own documentation and to show what I am doing. If you choose to act on any of this information, you do so at your own risk, and I will not be held responsible for any outcomes. Please conduct your own research and make informed decisions.
