REQBTC trade ideas

#REQ technicals are excellent, bullish bat confirmed#REQ has been consolidating nicely for quite some time and is due for a pump. Indicators are ripe: Stoch crossing over and forming a double bottom, indicating an uptrend is to come. MACD flat waiting to crossover, will happen once we attempt to break red downtrend line. RSI bottomed out close to 20. Most importantly, bullish XABCD bat pattern is confirmed. Targets are blue lines.


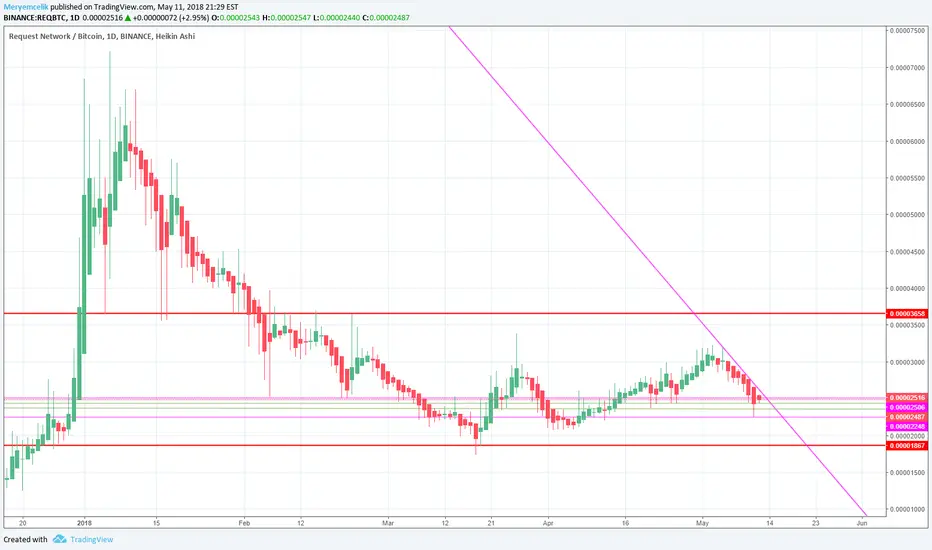
41% short term REQBTC-Return to equilibrium
-Divergence on RSI down to 4hr
-BTC Rally
Target 1: Fib 3000 level

A Long-term Buy trading opportunity for REQBTC , Don't miss it..Technical analysis:
.REQUEST-NETWORK/BITCOIN is in a Range Bound and Beginning of up trend is expected.
.The price is below the 21-Day WEMA which acts as a dynamic resistance.
.The RSI is at 36.
Trading suggestion:
Price is in the support zone (0.0000237 to 0.0000173), traders can set orders based on Daily-Trading-Opportunities and expect to reach short-term targets.
.Beginning of entry zone (0.0000237)
.Ending of entry zone (0.0000173)
Entry signal:
Signal to enter the market occurs when the price comes to "Buy zone" then forms one of the reversal patterns, whether "Bullish Engulfing" , "Hammer" or "Valley" , in other words,
NO entry signal when the price comes to the zone BUT after any of reversal patterns is formed in the zone.
To learn more about "Entry signal" and special version of our "Price Action" strategy FOLLOW our lessons:
Take Profits:
TP1= @ 0.0000317
TP2= @ 0.0000383
TP3= @ 0.0000448
TP4= @ 0.0000566
TP5= @ 0.0000618
TP6= @ 0.0000722
TP7= Free


REQ - Ascending Triangle - BUY SIGNALBroken out of the long term wedge, ascending triangle formed, breakout pending.
REQ
BUY- 2900-3000
Sell Targets-
3150
3450
4100
4950
5100
6150
Stop loss:
2500

REQ LongAfter testing the 38% retracement, REQ is about to hit test it's trend line again to head up to retest.
Buy 270-280
Sell Targets
315
390+
Stop loss 240

REQ/BTC Trade In progressBought some REQ at 2750 satoshi a while back. Hasn't been moving great but it is building up a pattern like every Alt that has popped so far. A prominent wave 1 and Wave 3 under way. Looking to just hold until sell targets reached around 4700 satoshi and 6300 satoshi.


REQ BTC - So many good situations4h timeframe let's see another nice setup. Broke triangle , waiting for a retest and then long with a tight SL . Have a nice day traders and take care of your money ! Don't take that like a financial advice , remember that!!


REQ: So close to the breakout.REQ broke a key trend line today but still has one more to go before in full breakout mode. I do believe that we will have the breakout very soon. With very high volume the past 8 hours REQ should hold the .236 fib line and then start the big breakout. The price action looks good, this current candle looks like it is staying near its high rather than the lows and still has very high volume. The accumulation and distribution indicators look strong. The reason why it will go down a bit is because it broke a key trend line so it needs to retest that to ensure the breakout and the rsi is oversold.

If Req breake the yellow line , can reach another fib resistanceIf 4 hours candle stay the resistance over, this gonna try another fib resistance


REQ - Ascending Triangle - BUY SIGNALBroken out of the long term wedge , ascending triangle formed, breakout pending.
REQ
BUY- 2900-3000
Sell Targets-
3150
3450
4100
4950
5100
6150
Stop loss:
2500

REQ about to make moves?We have a bull pennant forming on the 4hr and a clear buy signal from the Ichi. I'm keeping a close eye on MACD and RSI and will base a buy now of 30 percent and another 70 percent if they become more bullish.
Buy 1: 3700-3800
Buy 2: Waiting for more bullish RSI and MACD
Target 1: 0.00003100
Target 2: 0.00003500
