XRP Breakout with Target at $4.80XRP just broke out of a typical complex wave 4 Elliott wave formation by completing the last 2D-candle. Consider taking profits in steps as wave 5 is often surprisingly short and disappointing. A $5–6 target is possible if bullish momentum persists, but monitor for early reversal signs.
RIPPLE trade ideas

ABC Correction to 0.702FIB?The B Leg might be in, UNLESS it breaks the ATH, this chart is invalid.
IMO, the real C leg WILL hit $0.94 -$0.74 hitting the 0.702FIB to hit the back test and $13/$17 narrative.

XRP $1.95DISCLAIMER:
This analysis is for educational and informational purposes only and does not constitute financial advice. I am not a licensed financial advisor or professional trader. Always do your own research and consult with a qualified financial professional before making any trading decisions.
XRP is showing clear signs of weakness as price approaches the long-term descending trendline. Back on May 14th, we saw a strong bearish reaction — a thick-bodied candle rejecting directly off the trendline. Since then, price has struggled to revisit the trendline, failing to even tap it again.
Most recently, XRP has been leaving repeated upside wicks, suggesting aggressive sell orders are filling around the 1.27 extension, which I believe is being defended by a hidden bearish order block. Price action confirms that buyers are being absorbed before a full retest of the trendline.
This reinforces the short bias with a setup targeting a break below $1.95.
• Entry: Below $2.22
• Stop Loss: $2.2675
• Take Profit: $1.95

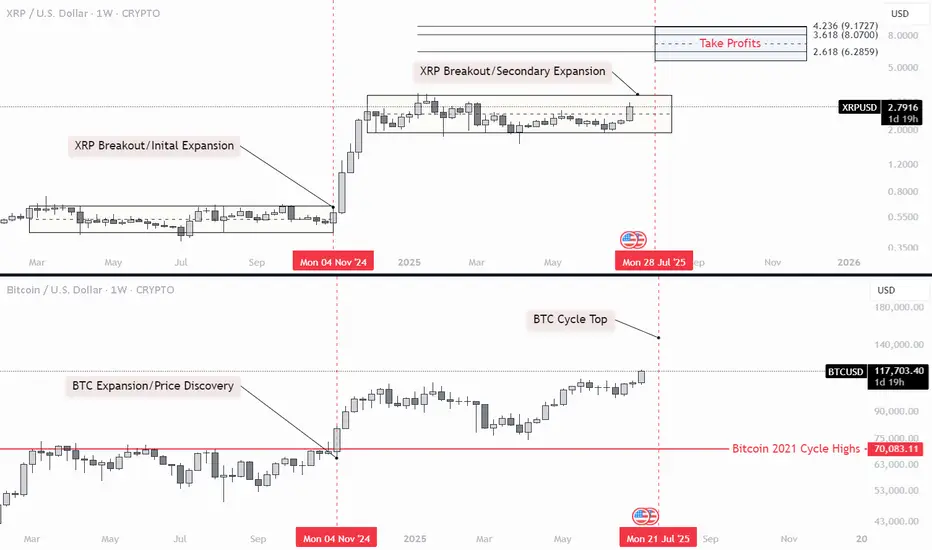
2025 - XRP Two MovesXRP typically moves twice during the cycle: once when BTC breaks its previous cycle highs, and again when BTC tops out at the end of the cycle. These moves often occur in waves of equal length within a 365-day window.
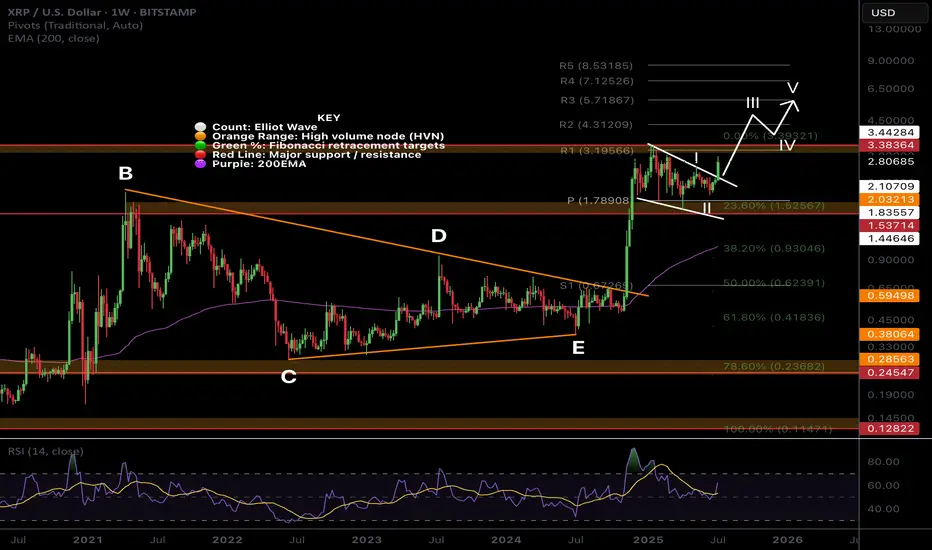
$XRP Macro Tiangle Final Thrust ContinuationCRYPTOCAP:XRP completed a macro triangle pattern last year. Triangles proceed a terminal motif wave which already completed a wave 3.
Wave (3) of (5) is underway with a terminal target around $5.7 after price broke out of the pennant / wedge pattern.
Weekly RSI confirmed bullish divergence.
Safe trading
$1.21.... 0.702fib retestdont hate, but xrp didnt break out of the flag pole yet and potentially building a C leg down to $1.21 to retest the 0.702fib.
$1.21 being a wick grab if youre an xrp crackhead buying at 3am.
BUT, if xrp does breakout of the flag pole, buy the C leg on the backtest of the top of the pole.

XRP .. few weeks before next bull?A new low is possible before Bull run!
it may be huge or one candle ,,
don't take the fractal exactly as you see for every movement

XRP ($15-$22) (Might Overextend to $27-$33)XRP ($15-$22) (Might Overextend to $27-$33). I am not sure about the next bear market bottom, my numbers have been coming to $4.50-$6.50

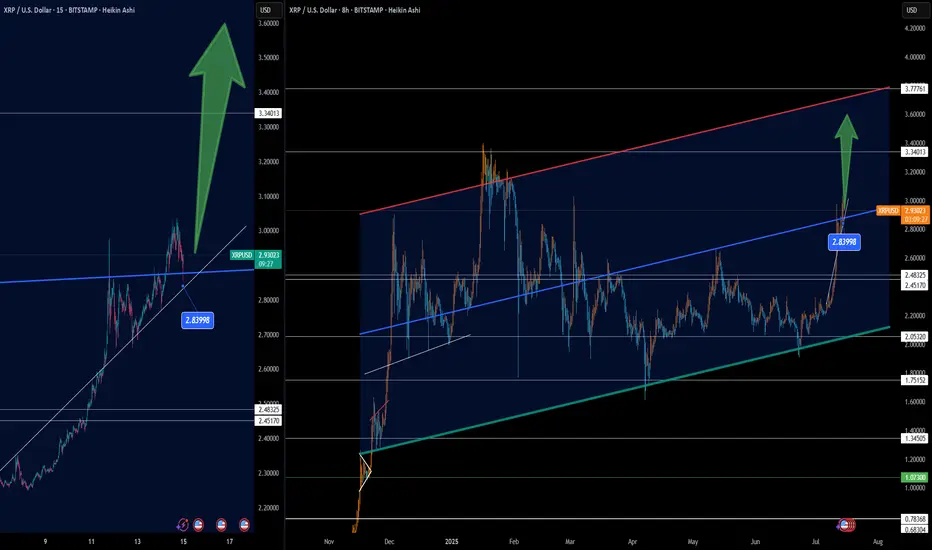
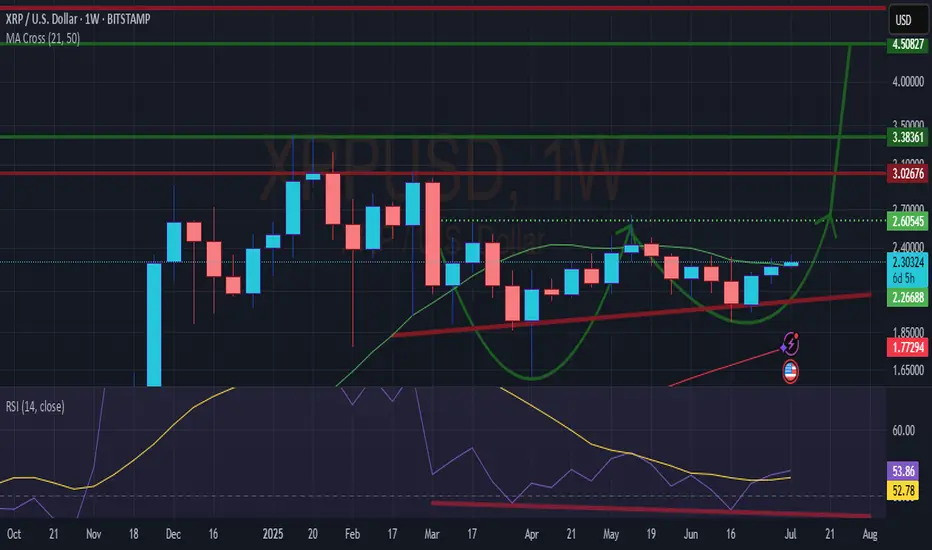
XRP Bullish Continuation Eyes Key Resistance at $3.34🚀📈 XRP Bullish Continuation Eyes Key Resistance at $3.34 💥🧠
XRP is showing remarkable strength as it continues to push higher within a well-defined ascending channel. On the 8H chart, we can see price breaking through mid-channel resistance, now retesting the zone around $2.84. This level acted as both a prior resistance and now potentially a launchpad for the next leg up.
The structure suggests:
🔹 A breakout retest scenario, confirming bullish continuation
🔹 Immediate resistance at $3.34, followed by the upper boundary of the channel near $3.77
🔹 Strong support from the dynamic trendline and former breakout zone
The 15-min Heikin Ashi view reinforces momentum: price is respecting the ascending trendline and holding above key breakout levels.
📊 As long as price holds above $2.84, this breakout remains valid, with the potential to target the upper channel resistance.
Technical traders may be watching for:
✅ A bullish engulfing or confirmation candle near current levels
✅ Volume spike on retest bounce
✅ Divergence or RSI confirmation on lower timeframes
Patience pays when structure aligns. Let's see if XRP delivers the full move.
One Love,
The FXPROFESSOR 💙
Disclosure: I am happy to be part of the Trade Nation's Influencer program and receive a monthly fee for using their TradingView charts in my analysis. Awesome broker, where the trader really comes first! 🌟🤝📈
XRPUSD Double BottomHi all, looking on the weekly, this might be a larger run ahead of us.
The weekly shows a Double Bottom, With Hidden Bullish Divergence.
Should reach $4.5 according to the larger cup size, maybe $5.
The divergence makes it more probable to break out.
Not financial advice, just my next move.
Happy & safe trading.
huge cup and handle pattern target: 5$
The cup and handle pattern is a bullish continuation chart pattern that signals a potential upward price movement. It resembles a teacup with a handle, where the "cup" is a rounded bottom and the "handle" is a smaller downward drift. A breakout above the handle's resistance level suggests a continuation of the prior uptrend.
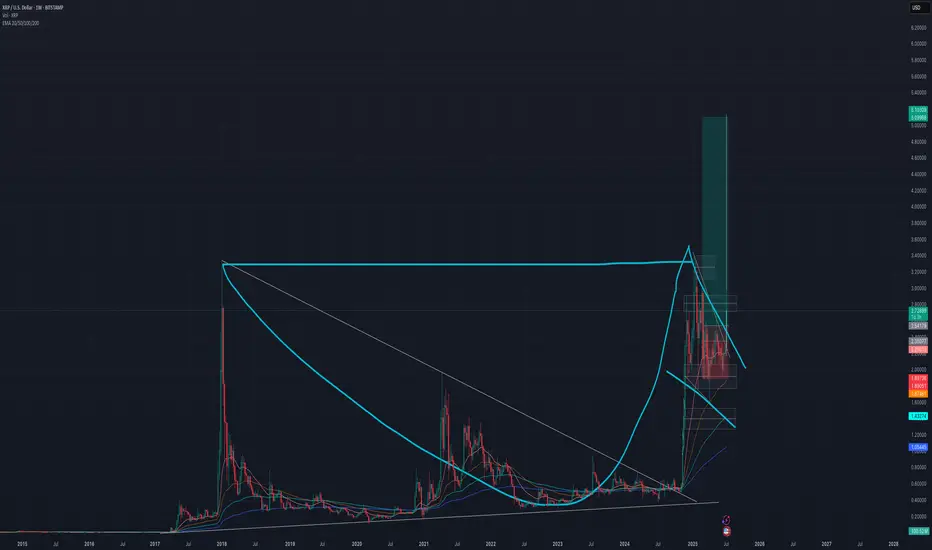
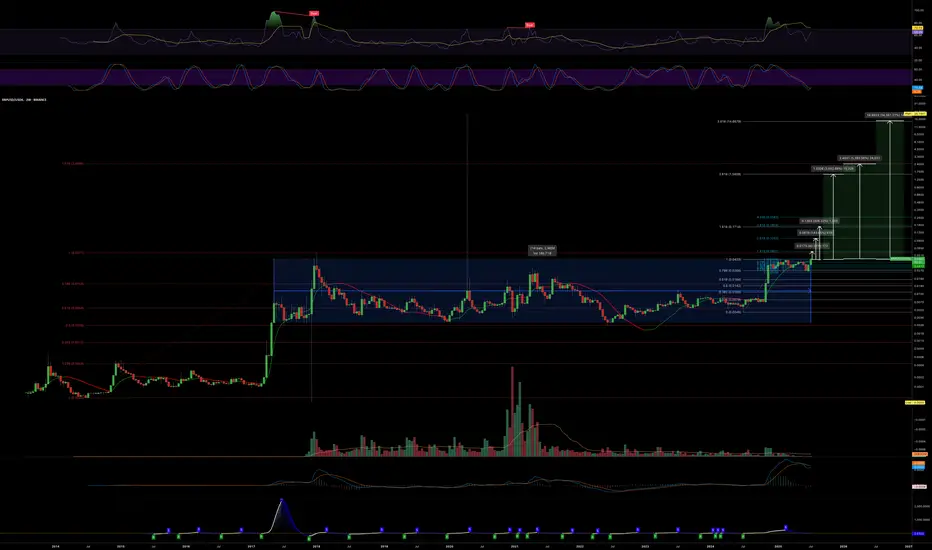
XRP/USDT Monthly Chart: History Repeating Itself?Hey traders! Let’s dive into this monthly XRP/USDT chart. I’ll be honest — I’m skeptical about this outcome, but let’s break it down because it could actually happen!
The chart screams déjà vu, with XRP’s price action mirroring the 2014-2018 period. Back then, XRP broke out from its 2014 ATH in 2017, leading to a massive rally. Fast forward to now, and we’re seeing a similar setup, but with a twist. XRP is struggling to break through the 2018 ATH resistance zone around $3.31, which reminds me of the Breakout Consolidation phase we saw in 2017. Historically, this consolidation led to a breakout, and the chart hints at a potential repeat!
If XRP breaks out soon, we could see a parabolic move, potentially targeting much higher levels. However, the current resistance is a tough hurdle, and if it fails, we might see a pullback to lower supports.
Key Levels to Watch:
Resistance: $3.31 (2018 ATH)
Support: $1.643 (previous consolidation low)
Breakout Target: To be determined (potentially parabolic)
Breakdown Risk: $0.650
I’m not fully convinced, but the setup is intriguing — could this be XRP’s moment to shine? What do you think? Let’s discuss below!

You Are Getting Ripped Off On XRP.Look at the massive volume the last year. Look at the news and how this has gone mainstream.
SEC, Potential ETF, Trump elected, Government acceptance etc...
And yet it still cant break 2018 highs.
One would thing with all the bagholders since 2018 highs $3.84. All that new money coming in tokens would be scarce and mixed with the constant positive news, a new all time high should have been met a long time ago..
XRPIT has rejection from base AOi and looks like it will head up till the base line rejection of xrp

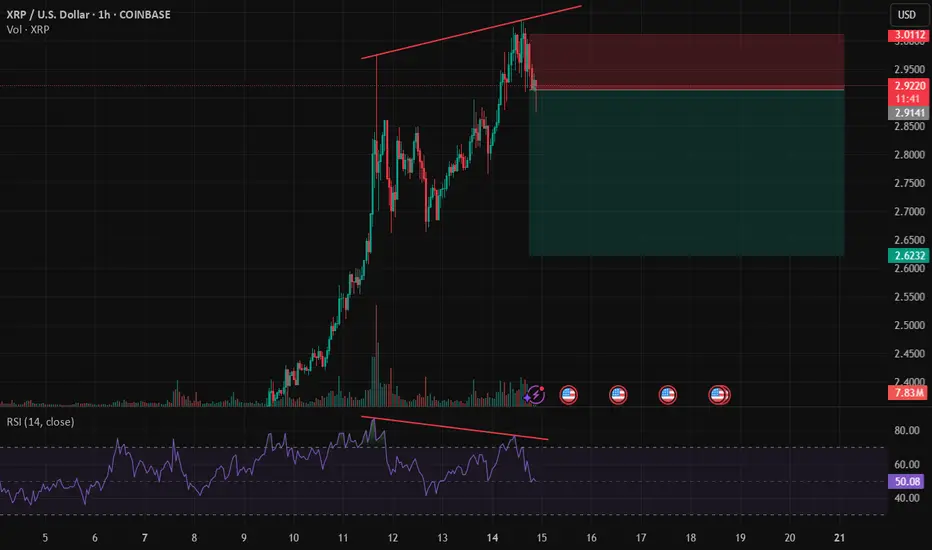
XRP / USD - SHORT TERM TREND UPDATEXRP is coiled in a large symmetrical triangle across all major timeframes (4H, 1D, 1W), with momentum building. The key level to watch is a breakout above $2.50 with strong volume, which could push price toward $3.20–$3.40. On the downside, if $2.00 breaks with conviction, expect a retest of the $1.80–$1.60 range. MACD and RSI on both the daily and 4H show bullish setups, and volume is low — suggesting a breakout is near. The move is likely to happen within the next few days to two weeks as price nears the triangle apex.

Double topA short term correction on this double top as the RSI is loosing momentum, providing a regular divergency. It could be sellers taking advantaged of high price, buyers taking profit or trapped buyers from previous highs getting out.
Everybody and their mother is waiting for another bigger XRP DIPEveryone and their mother is waiting for an XRP dip. The biggest liquidation wave of all time happened last week. But nothing is enough for them and they assume that the market will be so kind as to offer another place to buy and win.
The train has already left and the journey is just beginning. I can't give exact dates but my graph follows the historical price development of XRP in 2017-2018 when it rose explosively. A similar graph adjusted to today's prices could roughly raise XRP 0.5$->3$->10$->100$ which could be the peak prices of this bull run in about a year.
nfa dyor ...

XRP: $10 Breakout? Watch These Algorithmic Windows!This XRP analysis highlights "algorithmic departure windows" (blue circles) where explosive price moves can occur.
Whenever price enters a blue circle, XRP can launch to $10 or higher instantly or within 33 days—no matter the news.
**Key Dates to Watch:
**Possible Departure: July 10, 2025 (fundamentals align)
**Other Windows: May 19 - August 11, 2025; October 22 – November 18, 2025
**Major Target Zone: $8.50–$11.50 (December 25, 2025 – January 26, 2026)
History shows that once price breaks out from these departure windows, XRP can reach its upper targets rapidly—sometimes in a single day, but almost always within 33 days or less.
News is the excuse for the moves—algorithms deliver the predetermined price.

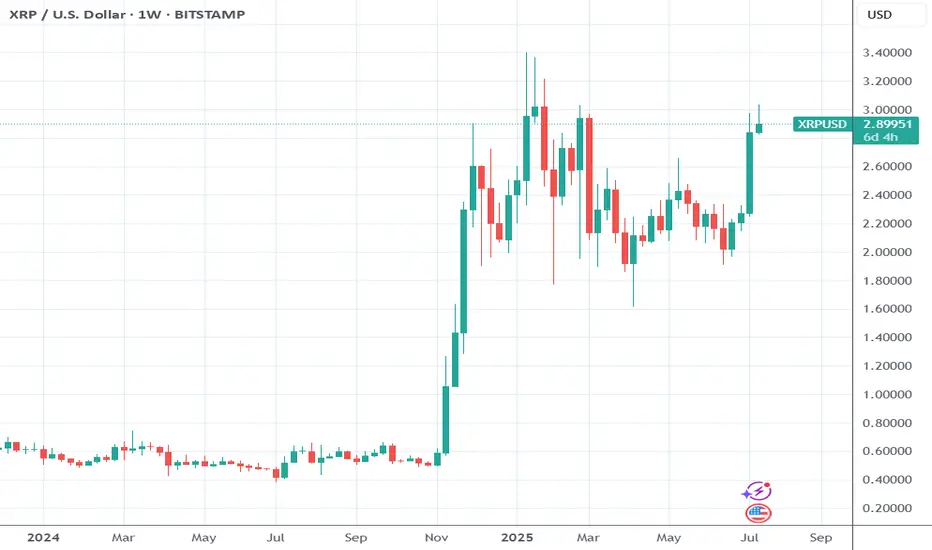
XRP Weekly ChartMoving up within this range since recent highs.
See if it breaks above $2.50 again or if it rejects and continues lower.
Breaking above last weeks candle already.

XRP - First ConfirmationPlease refer to our previous post:
After pointing out the gravestone doji in the last post that was likely to send price downwards, we also listed the way this major bearish signal could be reversed. We stated "The only way this can be negated in the short term is if we print a green daily candle tomorrow negating the confirmation of the gravestone doji."
That is exactly what we saw. We printed a green daily candle the next day that negated the bearishness of that gravestone doji. Now we are seeing the early signs of a massive XRP breakout.
Now we want to watch for the second confirmation to confirm the breakout. This could come in two forms. Either price drops back down to the orange trendline and confirm that level of old resistance as new support or price continues its rally to the upside and breaks our previous LTF high around $2.65.

Wait for XRPXRP has been consolidating above the $2 level for nearly seven months.
The current resistance is defined by a descending trendline that originates from mid-January 2025.
A breakout above this trendline would signal renewed bullish momentum—and could present a strong entry opportunity.
Disclaimer:
This analysis is based on my personnal views and is not a financial advice. Risk is under your control.

XRPUSD SELL 3.197On the daily chart, XRPUSD stabilized and rebounded, with short-term bulls in the lead. At present, attention can be paid to the resistance near 3.197 above, which is a potential short position for a bearish bat pattern. At the same time, this position is in the previous supply area, and the downward target is around 2.340.

8 Year XRP / US OIL Range Break out?Not to get ahead of myself, but... The 8 year range XRP has been in is about to give, too.
The fibonaccis on that point to (at current oil prices):
- $110 (also in range of a number I'd called for)
- $165 (also in range of a number I'd called for)
- $1035 (w/ full global adoption and swift - not out of the question, but I hadn't been able to substantiate this high with my current model. But I am over solving in the model and have a lot of conservative assumptions, basic math could support it - but alot of unknowns getting there.)