RIPPLE trade ideas

Ripple Elliott WaveTriangle
Break of the ascending trendline at the bottom of the triangle
Pullback
Price drop?
Ripple
No patience
No time

XRP break 2.24 bullish, is not, as low as $1.28Traders,
I have to make this quick I was bit by a brown recluse and put it off for a day or two longer than I should have. So I need to Skedaddle to the hospital super quick and fast!
Ok, here’s how I see it. I’m going to post this as a short to mid term trade but explain the long term possibilities. Considering this post is being done via my Moble rather than PC it just doesn’t make sense with my time and options.
so here’s what you’re gonna get the short term trade which I’ve labeled very clearly on the chart and the larger timeframe includes an Elliot wave analysis being that we clearly have a zigzagging consolidation wave that could do one of two things from here if we break about $2.24 we should be starting the next expansion wave. I will do an update if we do do that on this published trade to give an idea of where the price action could go but my immediate thoughts range from $9 to $27.
However, I want everybody to be cautious of a fake out as we are seemingly getting bullish on the weekend which I will be checking liquidity on all of the major alt coins and bitcoin before the weekend is over on our VIP live trading class that we do at 7 o’clock on Sunday night Eastern standard time. Yet, I will share my findings of the liquidity with everyone for this week only. As we definitely want to help as many newcomers and experience, traders, see manipulation, just in case it shows up before it plays out. There are many tools on trading view to find high buildup of large liquidity that the market makers could sweep down and take out if during this weekend we get really bullish And tons of money comes into the market from people’s tax returns, creating a pool of guppies that the market maker may just eat up one more time.
Which brings me to my thought of us potentially revisiting the .65 fib, the .618 or even all the way down to the .5 fib, which is at around $1.23. Nothing in trading is 100% so take my thoughts and stride. yet, I’ve been through three bull runs as a successful trader and market manipulation has been one of my main focuses purchasing mini subscriptions to different tools that give me information so we can take advantage of what the market maker does as opposed to be part of its liquidity grab.
For everyone reading this in the VIP group as you know normal time on Sunday, we will be having the recorded Zoom meeting, but I highly suggest that you make it because this is going one of two ways and there’s a big opportunity here to make some pretty serious pips in my opinion. If you’re not part of our group, I hope you use this information wisely in your research to come up with your decisions, but keep in mind, we are all just here for entertainment purposes! Following every single word from a trader online should never be your gospel to put tons of your money into the market in which ever way that trader is preaching the market will go. Learn risk management, if you don’t feel confident in the research that you’re doing or the traders that you are following are pointing at different directions just make sure you know why they’re pointing in that directions as it could quickly go both ways as we’ve seen recently. With that being said also know that the market maker always goes for liquidity point blank and simple! This is why the majority of traders are unsuccessful in this game because the easy information to learn online for free teaches you stuff that large trading firms have algorithms to find And come sweep in your losses to their profits.
I can’t necessarily say that the exchanges are our biggest worry, but it’s always made me believe most likely they are considering most of these exchanges are also trading as market makers, probably some insider trading with alot of them. The current element of little laws and wishy washy regulation (as much as it will likely stunt this bull run for a few months, or maybe not… being that Trump has given US regulating agencies 180 days from January to have firm regs in place) albeit, Some that are reading this, I’m sure take advantage of it yet, once it’s set in place we will have a little less wild, wild West and less decent traders in traditional markets who hate crypto because of the manipulation and the rug poles and what not will and I’m just guessing here most likely have a clear path to becoming a more profitable trade.
I’m not here to demonize exchanges just keep in mind they have all of the information that you have Placed on their exchange and given them freely by checking off the terms of service and signing up for your account. Lots of these exchanges still have very little regulation and trust you, Me that they are raking in as much as they possibly can to the extent of the little regulation in the country, they are regulated in if they are even bound to abiding by it, as I’m sure, as we know, some folks have already been arrested and indicted for certain things that I will leave for you to search and find on your own. But, my point being is you need to also be very careful of the exchanges that you choose.
In my best opinion, the exchanges with the most amount of liquidity on them makes it more difficult for manipulation to happen yet, it sure still does!
As always friends, stay profitable and I hope this rant that I just went on, helps you in someway over this Easter weekend and I pray you all have an amazing time with your families and if not, then have an amazing time trading and I hope my words have helped!
Stay Profitable,
Savvy

Xrp - Don't Underestimate The Bulls!Xrp ( CRYPTO:XRPUSD ) is bullish despite the recent drop:
Click chart above to see the detailed analysis👆🏻
Yes, we have been seeing a quite strong correction of about -50% on Xrp over the past couple of months. But no, this bullrun doesn't seem to be over yet but instead Xrp is creating a significant bullish break and retest formation. So if we get the bullish confirmation, we might see new highs.
Levels to watch: $1.8, $3.0
Keep your long term vision,
Philip (BasicTrading)

XRP AND CRYPTO WHERE DO WE STAND NOW? 🔥 Hey hey, hope all is well, it's another day and another chance to make a change and difference so let's keep at it and give it our best.
🔥 Last few weeks as shown in the chart below we've been following XRP which has been stuck within this descending channel and dragged down along with the S&P 500 as the market took a dive the last few weeks with Trump's tariffs and all the uncertainty surrounding him.
🔥Next we'll look to our 1 hour chart depicting that exit from our descending channel with the horizontal channel as well signifying strength above our $2.00 mark with bulls currently taking the lead, especially as the S&P 500 and market has been more optimistic the last few days contributing to things.
🔥 Main thing right now is to watch that horizontal level and that $2.3 mark which has proved to be resistance a couple times already so we can look to that for a pivot or possible breakout indicator when we come back up again to that mark so I'd set some alerts for that as well as $2.15 which is the top of our horizontal channel. I've been following this channel since the 19th and we can see just the kind of impact it'd had on price action from when we formed this on the 19th as shown below:
🔥 Since then it'd been pretty clear that once we exited the descending channel traders then took to that horizontal channel for price action, indicators as we can see we fell out of the channel once or two before getting pulled back in and breaking out and above the channel bringing us to where we currently sit above it and with that 200 EMA underneath us.
🔥 Next few days I would keep mindful of that 200 EMA as well as the channel, no doubt if we fall back within the channel we'll likely be caught up with some sideways trading action again as traders search for the next breakout or fall depending on how the market sentiment is next week, most of that will fall upon Trump and his words.
🔥 It should be noted that in the last few day's Trump's tone and stances have shifted with him essentially turning down the flame as he expressed, especially after Monday in which trump met with the CEO's for Walmart, Target, and Home Depot which are amongst three of the nations largest retailers with the CEO's warning trump on the effects of his tarrifs and how it would leave shelves empty and disrupt their supply chains. This meet seemingly promtped Trump to shift his stance announcing on Tuesday that he was in the works on trade talks with China looking at much lower tariff deal than the current 145% and clarifying that he had no plan or intention on firing Powell which spread fear and uncertainty in the market last week with some rumors floating around. So we'll have to see what stance Trump takes next week and if he can keep the flame down, and linked below is a reference link to an article for anyone else that wants to read up more:
www.axios.com
🔥 As always, so grateful for the support and everything, appreciate you guys and wishing all the best till next, let's keep our heads up and keep pushing!
Best regards,
Rock'

XRP is looking like it may trade back to the equilibrium zone.XRP has been struggling to gain a significant amount of ground and is, in my opinion, one of the most heavily manipulated cryptos in the entire cryptosphere. That should tell you something about its long-term potential if the powers that be are willing to put so much time and effort into keeping its price suppressed.
Good luck, and always use a stop-loss!

XRPAs we bear the end of April, we should see continuation to the upside eyeing $2.50.
May is filled with ETFs going Live, Paul Atkins will come to a conclusion on the XRP v SEC case, plus many more catalyst.
Once we break $2.50 we will hit $3, very quickly. From there, the upside is hard to predict. We've seen $5 - $100 by the end of year, but in all honest. We must stay patient, and continue to stack our bags.
THIS IS NOT FINANCIAL ADVICE. IT IS MY OPINION ONLY.

XRP/USD WILL CRASH! THE BEST OPTION FOR ENTRY! 99%Why I think it is going to happen I don't think , to explain myself , whoever reads this article has every right to pass it by and not pay attention , but isn't this your chance now , I tell a tale , He who has not opened the door , he will never know what lies behind itGood start for entry shortFrom today on I will upload my analysis as well as my prediction totally for free, if you think I am right you can make your trades and like this post. Stay tuned for more like this in the future. Risk is your responsibility.My prediction which will come true

UPDATE ON XRP ANALYSISXRP/USD 4H - As you can see price has played out perfectly since the analysis that was sent out to you guys earlier on in the week.
Those of you who may have sold off some of your XRP could look to buy back in when we have confirmation of the next impulse.
I believe now we will see price correct itself trading us right the way down, putting fear in those who are unsure on the future of XRP, this will give us the opportunity to buy in at a great price later down the line.
I have gone ahead and held the coins I have and will continue to purchase further coins once we see price trade us lower down and into the Demand Zone I have marked out for us.
I will keep you all updated on anything I decide to do with this pair, should I buy in more or sell of coins I have I will let you all know!

XRPUSD - Still Hodling Long Term SupportSupport is forming above this horizontal line which has previously been as a point of resistance since 2017
Hodling very strongly right now, preparing for the next bullish move XRP is
Weekly timeframe

XRP Is Ready to ROCK AND ROLL After weeks of consolidation and textbook price behavior, XRP is finally showing signs of life.
🔹 Support held beautifully at the 20hr low
🔹 We're now seeing a strong reversal forming on the 5-day chart
🔹 Eyes on that previous high zone for the next target (📍$3.40 – $3.87)
The market doesn’t lie—it moves.
And when it respects your structure like this?
You don’t chase—you prepare. 🔍📈
Let’s see how this plays out. Bullish continuation in motion.

Is XRP forming a larger inverse H & S fractal pattern?XRP has just punched through the inverse head and shoulders pattern neck line, but I can't help but think this is a smaller part of a larger pattern (marked in white).
Good luck, and always use a stop loss!

ABC Correction likely overWe dealt with anasry ABC Correction which likely just ended.
I expect a big Moment for risk in the coming days and Weeks which will be confirmed with a sharp decline in Gold.
Stay sharp nothing is garuantied everything is relative.
I target Something in between of 5-10 Dollars
Stay blessed and good Luck!

XRP Bulls Break Resistance: $3 Target in Sight?Minor trend line resistance $2.12.
XRPUSD breaks minor trend line resistance after a long consolidation. It hit an intraday high of $2.2509 and is currently trading around $2.224. A daily close below $1.60 could signal a further minor bearish trend. XRP remains above both short-term (34 EMA and 55 EMA) and long-term moving averages (200-day EMA) on the 4-hour chart confirms bullish trend.
Resistance and Support Analysis
The immediate resistance level for XRP is around $2.25, and a breakout above this level will push prices higher to $2.60/$2.80/$3/$3.40/$4. Any breach above $4 confirms further bullishness, a jump to $5. On the downside, immediate support lies at $1.89 any break below targets $1.60, $1.27, $1.00, $0.85, and $0.74.
CCI(50)- Bullish
Directional Movement Index - Bullish
Trading Strategy Recommendation
It is good to buy on dips around $2.20 with SL around $1.80 with SL around $3/$3.35.

XRPUSD - If Wave (2) completedTrend:
Major Trend : Bullish
Minor Trend : Retracement
Note:-
Wave (1) completed with starting diagonal.
Wave (2) possibly completed with ABC.
Now price is moving up for Wave (3) with 5 sub-waves.
This is just my point of view. No trade recommendation. Please do your own analysis before placing any trade. TAYOR.


XRPOUR TIME IS GETTING CLOSER....
Paul Atkins is sworn in as SEC Chairman
Trump Media finalizes partnership with Crypto.com to launch ETFs
We will be retesting $2.50 very soon, and I'm expecting to go even higher if the positive news keeps rolling out.

Long OpportunityXRP is currently at a support level. Consider buying with a tight stop-loss. Target: 2.107.
Ripple Looking for 12$ next 60 daysThe U.S. Court of Appeals has GRANTED the joint motion by Ripple and the SEC to pause the ongoing appeal — signaling that a settlement could be imminent.
📄 No further briefs will be filed.
🗓 SEC has been ordered to submit a status report within 60 days.
⚖️ This move follows confirmation that both parties have reached an agreement-in-principle, pending final Commission approval.
What this means:
✅ Appeal proceedings are frozen
✅ Ripple gets breathing room
✅ Final resolution could be on the horizon
✅ Major regulatory precedent might soon be set

Weekly plan for XRPMarked the important levels in this video for this week and considered a few scenarios of price performance
Locally, the growth may continue and we will quickly see a breakdown of the 2.2 level
Write a comment with your coins & hit the like button, and I will make an analysis for you
The author's opinion may differ from yours,
Consider your risks.
Wish you successful trades! MURA

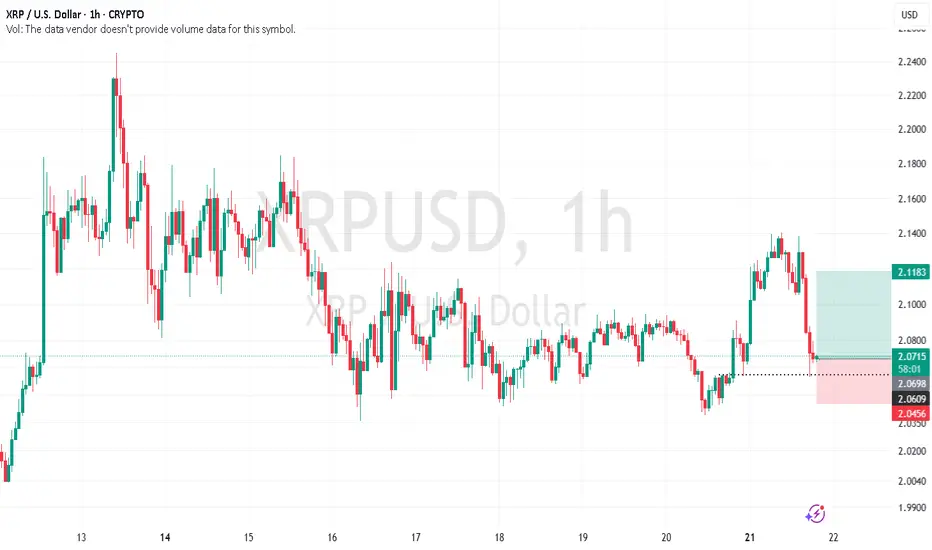
XRP - Modest outlook for 4.21.2025 -
We should see a little pullback around $2.10, I don't believe we will fall under $2.08 again.
With Derivatives trading going live on Coinbase today, we should see a nice push towards $2.25. If we get any more major news come out today, we will reach $2.50 in a hurry.
The bottom is in, if you missed buying under $2, now is your chance to buy under $3. I believe we won't be under $3 for much longer with so many catalyst coming.
THINGS TO WATCH:
- XRP has nearly 20 ETFs fixing to go Live over the next 30 days
- Trump has a plan with GOLD, potential pairing with XRP

Ripple: Target Zone Ahead!Ripple’s XRP remains on track to reach our magenta Target Zone between $1.03 and $0.38, even though the price has recently settled into another consolidation phase. Under our primary scenario, we expect the bottom of the magenta wave (2) to form within this range. Once that low is confirmed, fresh upward momentum should unfold during the following impulse wave (3), which has the potential to push XRP above the resistance at $3.39 and toward new all-time highs. However, if XRP breaks out to the upside before establishing the projected low within our zone, this zone will be considered void. We currently assign a 38% probability to this alternative scenario.

Is it time to all in on XRP ?Most of the time in crypto we sat past will happen again do you think it will this time too ?
