XRP Intra-day Analysis 18-Jul-2025Price action on XRP has shown upward momentum after reaching the 3.7 price level.
Possible scenarios include:
* The 3.3 level could come into focus if the market revisits this area. Market participants may monitor it for signs of seller exhaustion or potential reversal patterns.
* Should the price move lower, the 3.0 level may act as the next key area of interest. This round number is often viewed as a psychological level and may attract increased attention from traders.
* If there is a clear intraday move below the 3.0 level, the 2.6 area could emerge as another notable zone that some participants may consider relevant for future market reactions.
Disclaimer: easyMarkets Account on TradingView allows you to combine easyMarkets industry leading conditions, regulated trading and tight fixed spreads with TradingView's powerful social network for traders, advanced charting and analytics. Access no slippage on limit orders, tight fixed spreads, negative balance protection, no hidden fees or commission, and seamless integration.
Any opinions, news, research, analyses, prices, other information, or links to third-party sites contained on this website are provided on an "as-is" basis, are intended only to be informative, is not an advice nor a recommendation, nor research, or a record of our trading prices, or an offer of, or solicitation for a transaction in any financial instrument and thus should not be treated as such. The information provided does not involve any specific investment objectives, financial situation and needs of any specific person who may receive it. Please be aware, that past performance is not a reliable indicator of future performance and/or results. Past Performance or Forward-looking scenarios based upon the reasonable beliefs of the third-party provider are not a guarantee of future performance. Actual results may differ materially from those anticipated in forward-looking or past performance statements. easyMarkets makes no representation or warranty and assumes no liability as to the accuracy or completeness of the information provided, nor any loss arising from any investment based on a recommendation, forecast or any information supplied by any third-party.
RIPPLE trade ideas

Why XRP Holders Are About to Get Super Rich!I believe XRP is heading into a mass adoption cycle—something even bigger than what Bitcoin saw in 2021. We’re looking at a truly sustainable growth pattern fueled by a longer accumulation phase and crypto being adopted and invested in by major institutions.
This means we could see XRP skyrocket to $22 as my lowest target— and potentially even well over $100 per coin . This coin is truly ready for massive things. Be prepared!
Let me know what you think: Will XRP crash? Or is it heading for mass adoption? Share your thoughts in the comments below.
As always, stay profitable,
– Dalin Anderson

XRPUSD SELL 3.197On the daily chart, XRPUSD stabilized and rebounded, with short-term bulls in the lead. At present, attention can be paid to the resistance near 3.197 above, which is a potential short position for a bearish bat pattern. At the same time, this position is in the previous supply area, and the downward target is around 2.340.

XRP Weekly ChartMoving up within this range since recent highs.
See if it breaks above $2.50 again or if it rejects and continues lower.
Breaking above last weeks candle already.

$1.21.... 0.702fib retestdont hate, but xrp didnt break out of the flag pole yet and potentially building a C leg down to $1.21 to retest the 0.702fib.
$1.21 being a wick grab if youre an xrp crackhead buying at 3am.
BUT, if xrp does breakout of the flag pole, buy the C leg on the backtest of the top of the pole.

XRP: Breaking Out of Accumulation! Stablecoin Supercycle Part 5!🚨 XRP: Breaking Out of Accumulation! 🚨
XRP is missing Waves 3, 4, and 5 in green to complete the bull market. There are two ways to measure the target of Wave 5 which should be the bull market top. The 1st is taking the 1.618 fibbonaci retracement of Wave 4 which would give us a $5.39 XRP. The 2nd method is taking a 0.618 to 0.786 trend based fib extension which would give us a $6.21 to $8.97 XRP. In other words, this bull market should at least at the bare minimum give us a $5.39 XRP to $8.97 XRP.

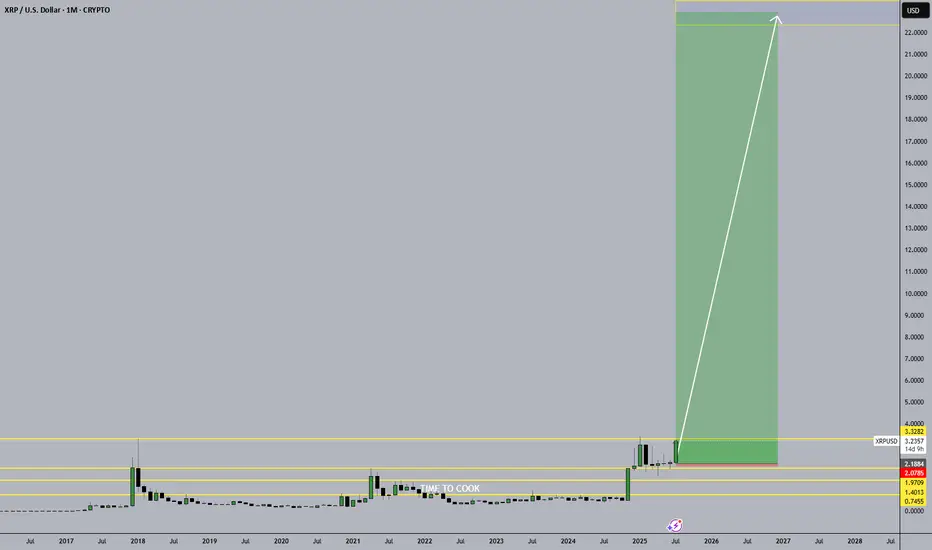
The RATS are out of the KITCHEN. It's TIME to COOKA simple trade - looking for XRP > $22 by December 2026, if it survives this breakout.
A token backed by dark state money.
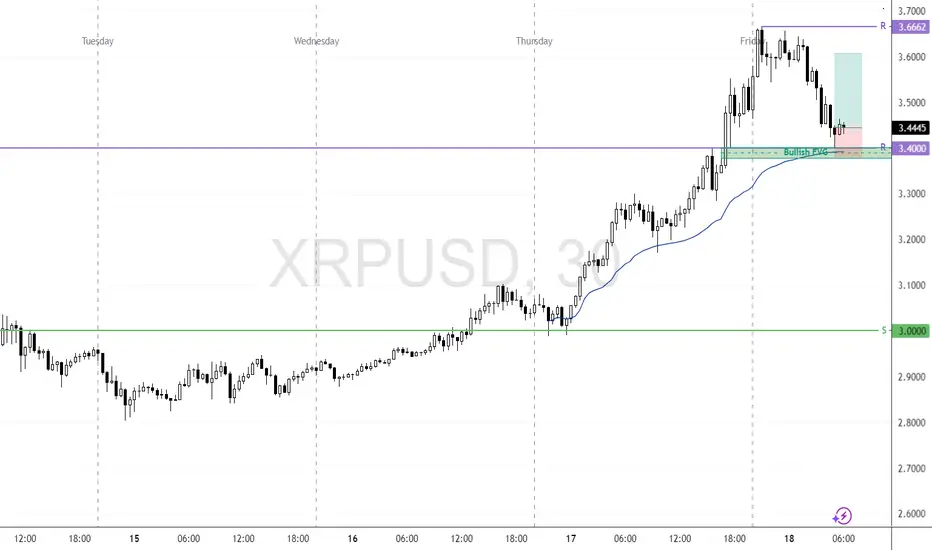
XRP Retests Previous All-Time High as Bullish Setup DevelopsFenzoFx—XRP (Ripple) is tested and has stayed above $3.40, the previous all-time high. This level acts as support, backed by the VWAP from Thursday's low and the bullish FVG.
If this level holds, we expect the cryptocurrency to aim higher, targeting $3.60, followed by $3.66.

XRP Approaches Judgment Day – Resistance Retest or Breakout?XRP is flying into a major historical resistance zone just under $3. Last time we were here, price was swiftly rejected — but this time, it’s backed by strong momentum, a bullish structure, and a cluster of Fib levels below. With Stoch RSI cooling off from overbought and buy signals dominating the recent trend, this is a make-or-break level to watch. A confirmed flip of this zone could open the door to new highs. 📊
🧠 Built using the Hull Suite Strategy+ Fibonacci + Stoch RSI

XRP rally to $8.50After XRP broke above the resistance at $1.80 now that became the major support for the past few months and XRP is taking off again.
According to this huge monthly triangle and calculate from the breakout, so the next target for XRP is $8.50 for the coming months.

XRP SHOOTS UP TO $3! 🌠 Wow, we'll, we've done it. We've hit $3 once again. Before I start this idea just want to give my thanks for tuning in, appreciate it.
🌠 This month has been pretty incredible for Ripple to say in the least from the BNY-Mellon Custodian Deal to Trump's Media company filing for a crypto Blue Chip ETF of which included the likes of XRP. With all the news and positive sentiment around XRP and Bitcoin which itself has hit a new All-Time-High hitting $123,000! Below I'll add a Bitcoin chart for reference:
🌠 To say in the least it's been a golden month for Crypto and Digital Assets. And one important thing to note is that as of today the Fedwire Funds Service is set to go live with the ISO 20022 standard starting July 14, 2025. The implementation will replace Fedwire's dated (FAIM) format with the ISO 20022 message format with the change happening over a single day.
🌠 For those that don't know ISO 20022 is a global messaging standard for financial transactions meant to reduce cost and fraud alongside automate transactions and reduce transactional costs. What this means for XRP is that it could become a much bigger player in cross-border payments now through RippleNet as XRP is one of the selected assets for the ISO 20022 standard.
🌠 ISO 20022 and global institutions will start utilizing XRP and it's ability to process transactions seemingly instantly and efficiently while significantly cutting down on cross border and transaction costs making it a considerably solution for banks and financial institutions. After all, if your objective is to make money, and you can make more money while cutting down on costs and making transactions, record keeping much simpler, then why not? Especially in an age where everyday things are continuously advancing and improving nobody want's to be left behind. Especially the big financial players.
🌠 Curious to see if prices can hold and keep pushing but just going off technical, we already know $3 is a tough point. At $3 just over 95% of XRP holders are in profit which makes a good reason for many to sell and take profit but with all the news and ISO now really kicking in we may not see as much selling, especially as holders are more confident and less likely to be swayed in letting go of their XRP. So it'll definitely be interesting to see how things play out.
🌠 Main thing will be Bitcoin, even if XRP holders hold I can't guarantee the same for Bitcoin, especially should it start to reverse, we know how financial institutions play taking advantage of the news. Just be cautious and set some price level alerts whether your trading XRP or Bitcoin.
🌠 In the long run things look very good regardless of what happens in the next week or two so keep that in mind. I'll be watching XRP to see if we can continue and break $3 but in my experience, with these impulse waves we usually see a big move up followed by some retracement as traders look to test support and liquidity so the waters may turn choppy but again like I said, we're here focused on the long term, whatever happens happens. We'll still be here for that but nonetheless the main objective is the longterm. $3 may seem like a lot but it's nothing compared to what XRP has in store.
🌠 This week is also 'Crypto Week' for lawmakers in DC as U.S lawmakers get ready to potentially pass changes in the regulatory setting when could push even more institutional demand further adding to the hype and optimism the crypto space has been running with as of lately.
🌠 Have to run but thanks as always for tuning in, really appreciate it and hope everyone is doing well! thanks as always and all the best till next. Feel free to keep posted and follow for more as always.
Best regards,
~ Rock '

Smart Money Trap or Final Push? | XRPUSD Ready for Rejection Professional XRPUSD Analysis (18 July 2025)
XRPUSD has shown a parabolic move recently, tapping into a high-probability resistance zone between $3.80 – $3.89, an area where liquidity likely sits for institutional players. Price reacted strongly upon entry, suggesting buy-side liquidity was swept and now potential distribution is in play.
🔑 Key Zones:
Resistance: $3.80 – $3.89 (potential reversal zone)
Target (Short-Term): $3.17
Strong Support: $1.80 – $2.00
🧠 Smart Money Perspective:
Market Structure Break (MSB): A clear sign of a possible internal shift after the impulsive rally.
Liquidity Sweep: Price wicked into resistance before pulling back — a classic trap for late buyers.
Expected Play: Look for a possible lower high formation, then continuation towards the target at $3.17.
📉 Trade Idea: A short opportunity can be considered if price fails to reclaim above $3.80 and shows further bearish price action or supply zone rejection confirmation.

XRP Price Corrects After Strong Rally: Support Levels in Focus
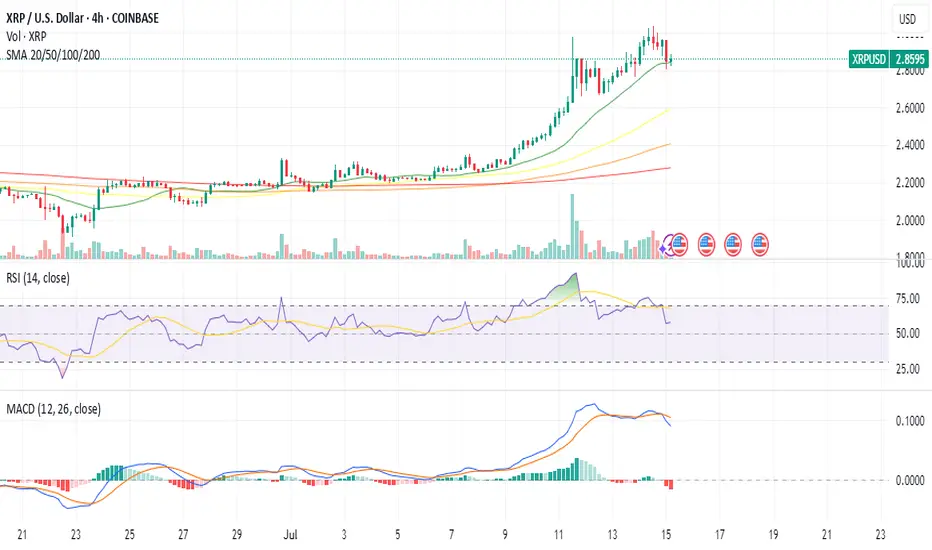
In the lead-up to the ETF announcement, XRP experienced a powerful rally, surging to fresh highs and demonstrating significant bullish momentum. The token climbed to the $2.85 zone, marking a substantial gain and outperforming many of its peers in the top tier of cryptocurrencies. This impressive run was fueled by a combination of factors, including the broader market upswing led by Bitcoin, growing optimism around Ripple's legal clarity, and the increasing institutional interest that the ETF launch now epitomizes.
However, following this strong upward move, a period of price correction was both expected and healthy. Profit-taking from short-term traders and the natural ebb and flow of the market have led to a slight pullback, bringing key support levels into the spotlight. Currently, XRP is trading above the crucial $2.80 mark and the 100-hourly Simple Moving Average, indicating that the underlying bullish sentiment remains intact.
A key technical feature that has emerged on the hourly chart of the XRP/USD pair is a bullish trend line with strong support forming at the $2.820 level. This trend line is acting as a critical floor for the price, and as long as XRP continues to trade above it, the potential for another upward leg remains high. The ability of the price to hold above this level suggests that buyers are actively stepping in to defend it, absorbing selling pressure and laying the groundwork for the next move higher.
Should the price dip below this immediate support, the next significant level to watch is the $2.750 zone. A successful defense of this area would further solidify the bullish case, demonstrating the resilience of the current uptrend. A break below this level, however, could signal a deeper correction and a potential shift in short-term market sentiment. For now, the price action suggests that the path of least resistance is to the upside, provided these key support levels hold firm.
The recent price correction, therefore, should not be viewed as a sign of weakness, but rather as a necessary consolidation phase before the next major rally. It has allowed the market to shake out over-leveraged positions and build a more solid foundation for future growth. The focus for traders in the immediate term will be on the interplay between the established support levels and the renewed buying pressure that is expected to accompany the ProShares XRP ETF launch.
A ‘Highly Rare’ Setup Eyes a 60% Gain Past $3
Adding to the bullish narrative surrounding XRP is a compelling technical analysis from a veteran trader who has identified a "highly rare continuation compound fulcrum" setup on the weekly price chart. This complex and infrequently observed pattern suggests that XRP is in the process of forming a major price breakout. The resolution of this setup, according to the analyst, could see the token's value surge by approximately 60%, pushing it past the psychological $3 barrier and towards a target of $4.47 in the coming months.
The "compound fulcrum" is a sophisticated chart pattern characterized by a complex base formation. It often consists of multiple smaller patterns, such as failed breakdowns, minor ranges, and wedges, that develop over an extended period. This intricate dance of price action serves to confuse the market, shaking out weaker hands while allowing more determined, long-term investors to accumulate their positions. Once this accumulation phase is complete and the balance of power shifts decisively in favor of the bulls, the price is expected to break out with significant force in the direction of the prevailing uptrend.
This bullish outlook is further substantiated by XRP's recent market performance. The token has posted its strongest weekly gain since last November, a clear indication of the growing momentum behind it. This rally has been accompanied by a significant increase in the number of "whale" wallets – those holding at least 1 million XRP. The accumulation of XRP by these large holders has reached a record high, signaling a profound and growing confidence among institutional and high-net-worth investors. This is a powerful leading indicator, as these market participants often have a longer-term perspective and their actions can foreshadow major price movements.
A break below the support line near $1.80 would invalidate this particular bullish setup. However, given the current market dynamics and the positive catalysts on the horizon, the probability of such a breakdown appears to be diminishing. The confluence of a rare and powerful technical pattern with strong fundamental developments creates a potent recipe for a significant price appreciation.
On-Chain Sentiment Transitions to "Belief-Denial"
Beyond the technical charts and institutional news, on-chain data provides another layer of insight into the current state of the XRP market, and the picture it paints is overwhelmingly positive. On-chain sentiment analysis shows that XRP is transitioning from the "optimism-anxiety" phase into the "belief-denial" phase. This shift is a crucial indicator of market psychology and often precedes a period of sustained price growth.
The "belief-denial" phase is characterized by a growing conviction among investors that the asset's value will continue to rise, despite any short-term corrections or pullbacks. It is a phase where the market begins to price in the long-term potential of the asset, moving beyond the initial excitement and into a more steadfast and resilient bullishness. This transition suggests that the current rally is not a fleeting speculative bubble, but rather a more sustainable and healthy uptrend.
Further supporting this view is the Net Unrealized Profit-Loss (NUPL) metric, which gauges the overall profitability of the market. In previous bull cycles, XRP's price corrections have often coincided with the NUPL entering the "euphoria-greed" zone, a sign of excessive speculation and an overheated market. However, the current data shows that the NUPL is indicating rising investor conviction without any signs of panic selling. This suggests that the current rally is built on a more solid foundation and has room to run before reaching a state of market euphoria.
The combination of increasing whale accumulation and the shift in on-chain sentiment points to a market that is maturing and gaining strength. The growing institutional confidence, as evidenced by the record number of whale wallets, is a testament to the long-term value proposition of XRP. As more large investors enter the market, they bring with them not only capital but also a sense of stability and a long-term investment horizon, which can help to dampen volatility and support a more sustainable price trajectory.
In conclusion, the upcoming launch of the ProShares XRP ETF on July 18 is set to be a watershed moment for Ripple and its native token. This event is not just a symbolic victory; it is a tangible catalyst that is expected to unlock significant institutional investment and propel XRP into a new era of mainstream adoption. The recent price correction, while causing some short-term uncertainty, has served to strengthen the underlying bullish structure, with key support levels at $2.820 and $2.750 holding firm.
The technical outlook is exceptionally bright, with a rare and powerful chart pattern suggesting a potential 60% rally to $4.47. This bullish forecast is strongly supported by the record accumulation of XRP by whale wallets and a clear shift in on-chain sentiment towards a more resilient "belief-denial" phase. As the worlds of traditional finance and digital assets continue to converge, XRP is positioning itself at the forefront of this revolution. The confluence of these powerful factors suggests that the stage is set for a significant and sustained upward movement in the price of XRP, making the coming weeks and months a period of intense interest and opportunity for the entire cryptocurrency market.
XRP just an IdeaI have plotted all these lines early 2025.
Now it approaching the right shoulder as I drew.
Let watch the next move of XRP. ☺️
#do you on research

Buy the dip. BullishWhen xrp breaks out of this pattern we can expect much more upside. Entering price discovery.

XRP Special UpdateJust wanted to give y'all a heads up that XRP is within the target box for (5) of ((3)). If you look up my old posts from March and even as far back as January, you will see I have not changed this chart at all. It is doing exactly what the pattern had been telling us it would. I went ahead and sold the rest of my position, so I am now flat XRP. Will it move higher still yet? I believe it will, yes. However, it could turn around very soon so I found it better to collect my profits while I had the opportunity. A wise man once said, "profit is a thief, take it while you can." Don't get greedy in this game, or you will come to regret it!
FYI: I think the 1.382 is a reasonable place for this pattern to end. If we can get a 3-wave retracement, there is a high probability I re-enter with tight stops for another leg higher.

XRP: 22 Minutes to LIFT OFF!I'm bullish, no question about it.
I wouldn't want to be on the other side of this trade right now. Everything I'm seeing points to a strong move coming soon.
Weekly cross is giving confirmation.
Bullish engulfing on the hourly, with momentum building across lower timeframes.
Price action suggests we're setting up for a retest of the previous ATH, and there's a real possibility of printing new highs from here.
Season’s about to kick off — I’m positioned accordingly.
Due in 15 minutes

Where Will XRP go?Short‑Term (some weeks)
-There’s strong excitement around the ProShares XRP ETF, launching July 18, 2025, which has boosted institutional inflows and whale wallet activity.
-Technical indicators currently signal overbought conditions, increasing the chance of a correction before further upward movement .
Mid‑Term (6–12 Months)
-Analysts are factoring in XRP potentially becoming a $750 billion asset ($12–$13 per XRP) through institutional acceptance and tokenization use cases .
-However, hitting that target will require transformative adoption, regulatory clarity, and heavy usage on the XRP Ledger.
Long‑Term (1–5 Years)
-If XRP captures large markets like CBDCs, remittances, real‑world asset tokenization, and stablecoin usage, prices could surge significantly.
-Still, such outcomes hinge on regulatory alignment and broad ecosystem deployment.
Recent Crypto Mining News
AI + Mining Megadeals
-CoreWeave (an AI infra firm) is acquiring Bitcoin miner Core Scientific for $9 billion, signaling a pivot from mining to AI compute.
Ethereum‑Backed Treasury Shifts
-BitMine Immersion saw its stock surge ~3,000%, moving its treasury to Ethereum.
-BIT Mining Ltd. doubled its stock after investing heavily in Solana, diversifying beyond Bitcoin.
Broader Mining & Regulation Trends
-U.S. “Crypto Week” is underway with bills like the CLARITY Act and GENIUS Act aiming to define stablecoin rules and improve clarity.
-Tech energy demands, especially from AI, now rival those of crypto mining—raising questions of sustainability.
-Disclaimer: This analysis is for informational and educational purposes only and does not constitute financial advice, investment recommendation, or an offer to buy or sell any securities. Stock prices, valuations, and performance metrics are subject to change and may be outdated. Always conduct your own due diligence and consult with a licensed financial advisor before making investment decisions. The information presented may contain inaccuracies and should not be solely relied upon for financial decisions. I am not personally liable for your own losses, this is not financial advise.

XRP ($15-$22) (Might Overextend to $27-$33)XRP ($15-$22) (Might Overextend to $27-$33). I am not sure about the next bear market bottom, my numbers have been coming to $4.50-$6.50

Birthday Month&All I Want Is for XRP Retest Those Previous HighRight now, XRP is sitting at $2.99. But once it reclaims and surpasses that $3.84 level, we’ll officially be in uncharted territory. Some people say XRP is going to $100... others say $525... and there are even calls for $10K.
All I know is this: once XRP prints a true higher high, the chart’s going parabolic. And I truly believe a lot of the Bitcoin maxis who clowned on XRP are going to be eating their words.
We’ve waited, we've studied, and we've held through the chaos.
So on my birthday, I’m not asking for much — just a retest of that all-time high, and a chance to ride the wave that’s been building for years.
📈 Let’s make history.

$XRP / $USOIL is breaking out of the 7.5 month range. It's time.CRYPTOCAP:XRP / TVC:USOIL is breaking out of the 7.5 month range. It's time.
Fibonacci says it's a 4x from here, $12 at current oil prices, within the $8-12 range I'd been calling for.
Other potential pivots (at current oil prices).
- $4.2
- $7.2
If Oil goes up and the chart structure holds - that effectively would be compounding in USD terms.

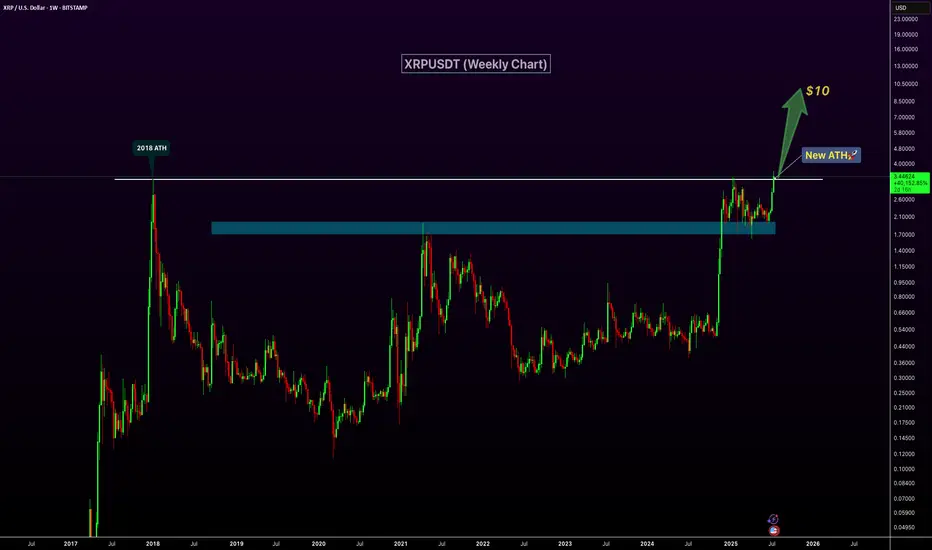
XRP Breaks 2018 High – New ATH Confirmed!XRP has officially broken above its 2018 peak, signaling a major bullish breakout and printing a new all-time high on the weekly chart. The previous resistance zone around $2.6–$3 has now flipped into strong support, confirming the strength of this move. With increasing volume and momentum behind the rally, XRP appears well-positioned for continued upside. The next key psychological target lies at $10, and current price action suggests a clear path toward that level. If bullish sentiment continues, this breakout could mark the beginning of a significant new uptrend.