Can XRP Reach $10? A Perfect Storm of Fundamentals and TechnicalFrom a fundamental standpoint, the Ripple vs. SEC lawsuit continues to act as a major overhang on XRP’s long-term valuation. However, with the SEC’s 60-day deadline approaching (June 16), a favorable outcome for Ripple could inject fresh confidence into the market. This coincides with a broader macro backdrop of rising global liquidity, which historically supports risk-on assets such as cryptocurrencies.
Technically, XRP is currently forming a classic bullish flag pattern on the higher timeframes—a continuation structure that often precedes strong upward moves. If price breaks above the flag’s resistance zone and enters a confirmed buy zone, a retest of the breakout area followed by bullish confirmation could signal the beginning of a larger move toward the $10 psychological level.
The alignment of a legal breakthrough, improving macro liquidity, and a bullish chart structure makes this a scenario worth watching closely.
RIPPLE trade ideas

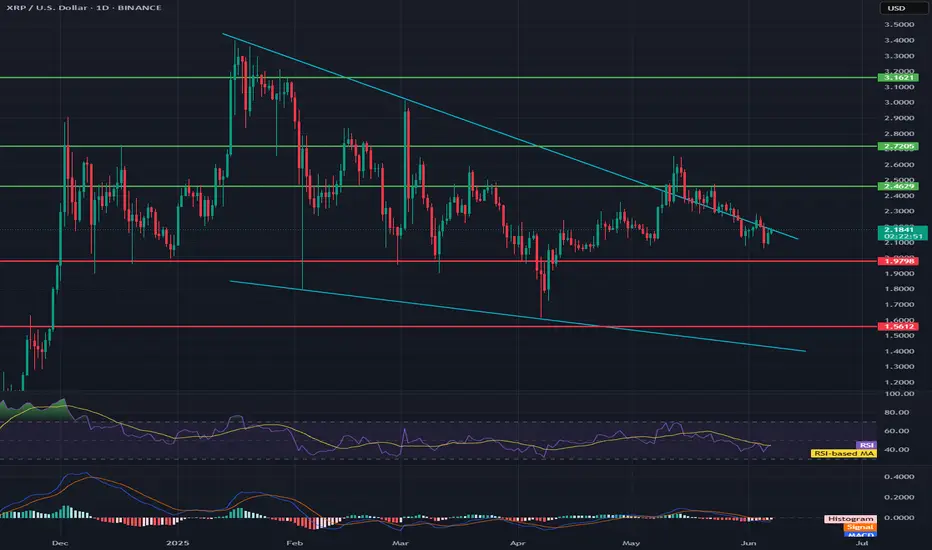
XRP/USD🔍1. Trend and Key Levels
General trend
In the medium term: We see a clear downtrend, marked by two wide blue trend lines (the upper line from the peak around $3.3, the lower from the local lows).
Recent weeks: Consolidation in a wide range between $2.72 and $1.98, with frequent attempts to break out.
📌2. Support and resistance levels
Green lines (resistance):
$3.16 — the historical peak of this wave, very strong resistance.
$2.72 — another strong resistance, around which the price was rejected several times.
$2.46 — local resistance, currently the price is below this level.
Red lines (support):
$1.98 — very important support, tested several times already.
$1.56 — lower support, coinciding with the lower line of the downtrend channel.
3. Market formations and structure
Declining channel: Wide channel marked by two blue lines. Price is moving in its lower half.
Short-term descending triangle: Visible at current levels – local peaks are getting lower, and support is around USD 1.98.
Volume: Volume advantage visible on descending candles.
📊4. Indicators
RSI
Currently around 40 — No clear advantage of the buyer side, slightly below the neutral zone. RSI does not give a signal of overbought or oversold.
RSI-based MA — Oscillates below the level of 50, which confirms the downtrend.
MACD
MAD and signal lines are below zero, without clear divergence.
Histogram: Slight advantage of bears – there is no signal to reverse the trend yet.
🧠5. Near-term scenarios
Bullish
Condition: Breakout above the local downtrend line (~$2.20–$2.25) and return above $2.46.
Target: $2.72 (test of resistance), further move possible to $3.16 in case of strong gains.
Bearish
Condition: Breakout and close below $1.98.
Target: $1.56 (main channel support), and even lower – lower channel line.
Sideways scenario
Further consolidation possible in the range of $2.46–$1.98, until a breakout from this range occurs.
📊6. Sentiment and summary
Medium-term trend: Down.
Buyers are weak, RSI low, MACD does not give a rebound signal yet.
Key level to watch: 1.98 USD – if it falls, the next stop is 1.56 USD.
Only a return above 2.46 USD may give the first signals of a trend change.
🧠Recommendation
For long-term players: Be careful, do not blindly catch the bottom.
For speculators: Play for a rebound only with a short stop below 1.98 USD.
For investors: Wait for a signal confirming a breakout from the channel or a clear divergence on the indicators.
XRPUSDTXRP is currently facing strong confluence resistance near the 0.5–0.618 Fibonacci zone (2.17–2.19), aligned with a descending trendline. The price has failed to break this area decisively, suggesting potential exhaustion of the recent bullish momentum. Unless we see a strong breakout above 2.20, a pullback toward the 2.14 and possibly 2.10 support zones remains likely. This zone acts as a key decision point for the next directional move.

XRP/USD Daily Chart Signals Continued Bearish Pressure
The current price is trading below the midline of the Bollinger Bands (usually a 20-day moving average), which typically indicates downward momentum.
The chart shows a pattern of descending highs and descending lows, which is a classic bearish structure.
The latest candle is red and pushing toward or near the lower Bollinger Band, suggesting increased selling pressure.
Price recently lost the $2.20–$2.30 support zone and is now testing the $2.00 psychological level. If this level breaks, it could open downside toward $1.90 or lower.


XRPUSD: 5 month consolidation ends and targets $8.00 XRP has turned bearish on its 1D technical outlook (RSI = 41.730, MACD = -0.027, ADX = 31.602) as the price has failed to break above the very tight consolidation that started after January's High. This pattern is however very similar to the June - November 2017 consolidation, which was the last accumulation phase before the eventual January 2018 top of that Cycle. That was accomplished a little over the 1.382 Fibonacci extension. This indicates that we should stay bullish on XRP as it can target again the 1.382 Fib, TP = 8.000.
## If you like our free content follow our profile to get more daily ideas. ##
## Comments and likes are greatly appreciated. ##

Weekly trading plan for XRPBINANCE:XRPUSD has shown a good upward correction over the last couple of days. Now the price has returned to the Pivot point and a local bullish divergence is already visible on the chart. If the price continues the downward movement now, I will consider entering near the support zone, in case the price starts to reverse in the near future, I will consider entering when the local hourly trend changes to green.
If the support is broken, we may see a continuation of the downward correction up to the 0.618 Fibonacci level. More details in the video
Write a comment with your coins & hit the like button and I will make an analysis for you
The author's opinion may differ from yours,
Consider your risks.
Wish you successful trades ! mura

XRPUSD is moving within the 2.1400 - 2.3035 range👀 Possible scenario:
On June 5, XRP traded at $2.20, down 2.36% in 24 hours. The crypto community remains engaged in discussions about XRP’s role in cross-border payments, Ripple’s partnerships, and regulatory challenges.
The ongoing US SEC vs. Ripple lawsuit may face delays as both parties have yet to properly refile their motions ahead of the June 16 deadline. Previously, a proposed settlement to reduce Ripple’s penalty to $50 million was rejected due to procedural errors. If no motion is refiled by June 16, the court may restart the case briefing. If a motion is pending, the process could extend by 60 days. Rumors suggest a possible settlement favoring Ripple, with an announcement expected around June 13, though nothing is confirmed. Meanwhile, XRP’s price has dropped about 8.8% over the past week amid the legal uncertainty.
✅Support and Resistance Levels
Now, the support level is located at 2.1400.
Resistance levels is now located at 2.3035.

XRP Eyes $2.22FenzoFx—XRP formed a double bottom at 2.218, aligning with Tuesday’s low. Price action set resistance at $2.22, where untriggered liquidity backed by a bearish Fair Value Gap (FVG) remains.
Stochastic exited oversold territory at 39 and is rising, suggesting bullish momentum may continue. If $2.18 support holds, XRP/USD could surpass $2.22 and form a higher high.
The bullish outlook is invalid if XRP declines and stabilizes below $2.18.

XRP IS LOSING hardas All the altcoins follows the big Bitcoin and his trends, XRP also is showing some raging mode.
the fact that his will go bearish in the next weeks, in order to gaim in liquidity, and deal with people's greed sentiment ( smart money ) my friend

Short term bullishPrice about to hit strong trend and a major level.
Short term bullish
Look on my chart

XRPUSD looks set to move higher XRPUSD looks set to move higher after stabilizing above 2.00–2.01. The price action suggests a potential bottom is forming, with a target around 3.50.

XRP - BULLISH MOMEMTUM START - FAKE OR NOT?Good Afternoon,
XRP looking good with some slight BULLISH volume starting. SO far the volume has surpassed previous high however it is far from settled.
ENJOY!

XRP: VIVOPOWER MAKES 100 MILLION DOLLAR XRP PURCHASEVIVOPOWER MAKES ASTONISHING 100 MILLION DOLLAR XRP PURCHASE
Video Timestamps:
0:00 - Vivopower purchases $100,000,000 of XRP
1:25 - XRP Risk Analysis
3:00 - XRP Regression Analysis
3:52 - XRP ETF Update
5:03 - XRP Wyckoff Reaccumulation Analysis
7:22 - META purchasing XRP!?!?!?

Xrp - New all time highs will come next!Xrp - CRYPTO:XRPUSD - is preparing for new all time highs:
(click chart above to see the in depth analysis👆🏻)
Xrp has clearly been trading sideways for the past 8 years. Meanwhile, market structure is respected perfectly and it seems to be just a matter of time until Xrp will create new all time highs. With the recent bullish break and retest, this scenario becomes even more likely.
Levels to watch: $3.0
Keep your long term vision!
Philip (BasicTrading)

XRP Holds Firm—Will Bulls Push It Higher?FenzoFx—XRP bounced from the $2.08 weekly resistance, aligning with the bullish Fair Value Gap. Currently, XRP consolidates at $2.17, with key resistance at $2.21.
A breakout above $2.21 could trigger bullish momentum toward $2.27. However, if XRP closes below $2.08, the downtrend may resume, targeting $2.00.

Ripple Stock Chart Fibonacci Analysis 060125Trading Idea
1) Find a FIBO slingshot
2) Check FIBO 61.80% level
3) Entry Point > 2.1/61.80%
Chart time frame:B
A) 15 min(1W-3M)
B) 1 hr(3M-6M)
C) 4 hr(6M-1year)
D) 1 day(1-3years)
Stock progress:A
A) Keep rising over 61.80% resistance
B) 61.80% resistance
C) 61.80% support
D) Hit the bottom
E) Hit the top
Stocks rise as they rise from support and fall from resistance. Our goal is to find a low support point and enter. It can be referred to as buying at the pullback point. The pullback point can be found with a Fibonacci extension of 61.80%. This is a step to find entry level. 1) Find a triangle (Fibonacci Speed Fan Line) that connects the high (resistance) and low (support) points of the stock in progress, where it is continuously expressed as a Slingshot, 2) and create a Fibonacci extension level for the first rising wave from the start point of slingshot pattern.
When the current price goes over 61.80% level , that can be a good entry point, especially if the SMA 100 and 200 curves are gathered together at 61.80%, it is a very good entry point.
As a great help, tradingview provides these Fibonacci speed fan lines and extension levels with ease. So if you use the Fibonacci fan line, the extension level, and the SMA 100/200 curve well, you can find an entry point for the stock market. At least you have to enter at this low point to avoid trading failure, and if you are skilled at entering this low point, with fibonacci6180 technique, your reading skill to chart will be greatly improved.
If you want to do day trading, please set the time frame to 5 minutes or 15 minutes, and you will see many of the low point of rising stocks.
If want to prefer long term range trading, you can set the time frame to 1 hr or 1 day.

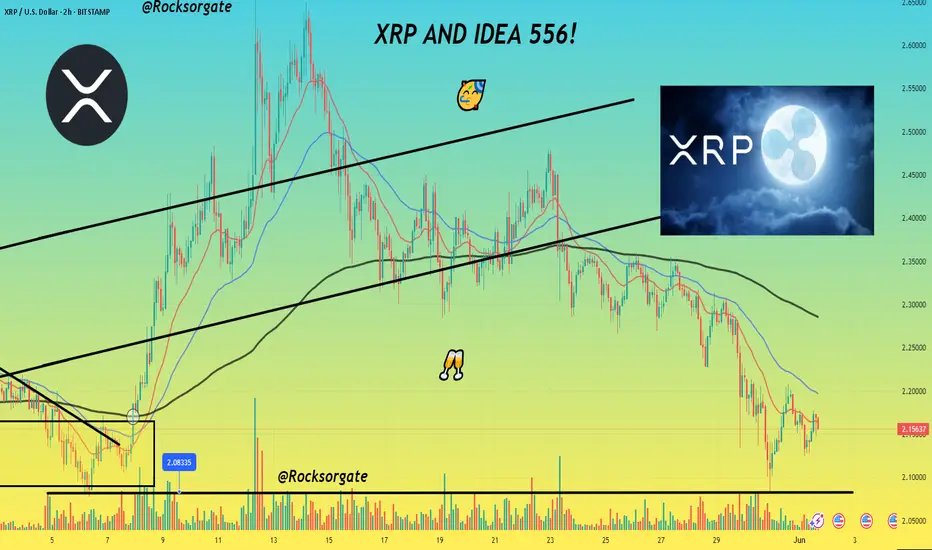
XRP AND IDEA 556!⭐ First thing's first, this is the 556 idea, crazy to say but here we are. Hope everyone is doing well today, it's a chill Sunday and all so we're gonna get a quick idea down for you.
⭐ Again, can't believe it, 556 ideas and counting! Feels like I just started this journey only a few months ago and yet here we are, 741 followers and counting, I couldn't have imagined that but I'm so grateful for it and each and every single one of you, thank you for joining me and supporting me on my journey as we continue to strive for nothing less than success.
⭐ Before we get going with this quick idea, feel free to leave a like and follow for many more great ideas to come! Got some good stuff in mind and excited for all the market has in store for us the next few months, and without further a due, let's give it our best!
⭐ Gonna keep this short and concise since I understand it's Sunday so let's get this done.
⭐ First thing's first, we already see we've exited our trend with that exit of the ascending channel in which we also lost the 200 EMA on the 2 hour timeframe prompting a bearish convergence as we kept trying to establish a higher high but without the support of our 200 EMA prompting the reversal which then formed this descending channel towards the end of May leading into June as referenced below:
⭐ We'll be looking to $2.08 for support should we end up reversing further which is a possibility though unlikely since we've deviated from that 200 EMA and soon enough we're going to have to converge and get a bullish crossover of that 200 EMA which will help send us back up. Till then it's fair game for Bulls and Bears, especially with BITSTAMP:BTCUSD sitting at $105,000 right now as many traders watch which direction Bitcoin looks to take next.
⭐ I'll be watching that $2.08 for support as well as the descending channel and 200 EMA, that's basically it right now, gonna stick to trading objectively and sticking to my indicators. Simply enough then, watch that descending channel to see if we continue within it and trend further down or if we can breakout and get a bullish crossover with our 200 EMA which could help prop us back up above that $2.3 range.
⭐ Gotta go, got a lot of things to get done as usual but thanks so much as always for the support! Still can't believe this makes idea 556! So grateful again for everyone and all the support as we climb this mountain, it may not be easy, but the view at the top will be more than worth it.
Best regards,
~ Rock '
XRP's Potential Path: A June Surge and a 2040 Vision The world of cryptocurrency is a realm of constant motion, characterized by breathtaking innovation, fervent communities, and, undeniably, significant price volatility. Among the many digital assets vying for attention and adoption, XRP stands out with its clear focus on revolutionizing cross-border payments and its long-standing, often tumultuous, relationship with regulatory bodies. Investors and enthusiasts alike are perpetually analyzing its next potential move, from short-term price surges to ambitious long-term valuations.
This article delves into two distinct yet interconnected facets of XRP's potential trajectory. First, we will explore four plausible catalysts that could ignite a significant, perhaps even 50%, price surge for XRP in the upcoming month of June. Following this near-term speculation, we will broaden our horizon to the year 2040, contemplating what XRP's price might look like and whether holding it could realistically pave the way for individuals to achieve the dream of quitting their traditional 9-to-5 employment. It is crucial to preface this exploration with a clear understanding: all cryptocurrency investments carry inherent risks, and future predictions, especially long-term ones, are speculative by nature.
Part 1: Four Potential Catalysts for a 50% XRP Surge in June
June is often a dynamic month for financial markets, and the cryptocurrency sphere is no exception. For XRP, several specific factors could converge to create a potent bullish environment, potentially driving its price upwards by a significant margin. While a 50% surge in a single month is ambitious, it's not unprecedented in the volatile crypto markets, especially for an asset with XRP's history and dedicated following.
1. Landmark Progress in the SEC Lawsuit
The most significant shadow looming over XRP for the past several years has undoubtedly been the lawsuit initiated by the U.S. Securities and Exchange Commission (SEC). This legal battle has created immense uncertainty, deterring some institutional investors and suppressing XRP's price performance compared to peers that enjoy greater regulatory clarity in the United States.
However, June could bring a pivotal development. Imagine a scenario where the courts deliver a summary judgment ruling that is overwhelmingly favorable to Ripple, the company most closely associated with XRP. This could involve a definitive statement that XRP, in its current form or in secondary market sales, is not a security. Alternatively, a settlement between Ripple and the SEC could be reached – one that the market perceives as a net positive for Ripple, perhaps involving a manageable fine and clear guidelines for future operations without crippling XRP's utility.
Such a breakthrough would be monumental. The removal of this regulatory overhang could unleash a torrent of buying pressure. Exchanges that delisted or halted XRP trading in the U.S. might swiftly relist, opening up a massive market. Institutional investors who have been waiting on the sidelines for legal clarity could finally enter, bringing substantial capital. The psychological impact alone would be immense, shifting sentiment from cautious to overtly bullish. In this environment, a 50% price surge, or even more, driven by relief, renewed confidence, and fresh capital inflows, is a distinct possibility.
2. Major Institutional Adoption or RippleNet Expansion
Beyond the courtroom, Ripple continues to build and expand its network, RippleNet, which leverages XRP for its On-Demand Liquidity (ODL) service to facilitate faster and cheaper cross-border payments. While progress has been steady, a blockbuster announcement in June could act as a powerful price catalyst.
Consider the possibility of a leading global bank, a household name in international finance, publicly announcing a strategic partnership with Ripple to utilize ODL for a significant payment corridor. Or perhaps a consortium of financial institutions in a major economic region declares its intention to adopt Ripple's technology, with XRP at its core. News of this magnitude would provide tangible proof of XRP's real-world utility and its potential to disrupt the traditional correspondent banking system.
Such an announcement would not only drive direct demand for XRP as ODL volume increases but also serve as a powerful validation of Ripple's business model. It would signal to the broader market that XRP is not just a speculative digital asset but a functional tool solving a multi-trillion-dollar problem. The narrative would shift towards adoption and utility, attracting investors focused on long-term fundamentals. This kind of news has historically moved XRP's price, and a sufficiently impactful partnership could easily fuel a 50% rally as the market recalculates XRP's potential market share in global payments.
3. A Resurging Altcoin Market Fueled by Broader Crypto Momentum
The cryptocurrency market often moves in waves, with Bitcoin typically leading the charge. When Bitcoin experiences a strong bullish phase, it tends to lift the entire market, eventually leading to what is known as an "altseason," where alternative cryptocurrencies (altcoins) like XRP see outsized gains as capital rotates from Bitcoin into higher-risk, higher-reward assets.
If June witnesses a significant Bitcoin rally, perhaps driven by macroeconomic factors, new institutional products, or positive regulatory news affecting the entire sector, XRP could be a prime beneficiary. Historically, XRP has demonstrated a tendency to make sharp, aggressive moves once broader market sentiment turns decisively bullish. It possesses a large, dedicated community and significant name recognition, making it a go-to choice for many investors looking to capitalize on altcoin rallies.
A 50% surge in this context would be a function of overall market exuberance. As "fear of missing out" (FOMO) kicks in, liquidity pours into the market, and assets like XRP, which may have underperformed during market consolidation phases, can quickly catch up and even outperform. If the broader crypto tide rises strongly in June, XRP is likely to be carried along with it, potentially reaching and exceeding that 50% gain threshold.
4. Significant Technical Breakout and Renewed Trader Sentiment
Financial markets, and particularly cryptocurrency markets, are heavily influenced by technical analysis – the study of price charts and trading volumes to predict future price movements. XRP's price chart currently shows several key long-term resistance levels. These are price points where selling pressure has historically overcome buying pressure, capping rallies.
A scenario where XRP decisively breaks above a critical multi-month or even multi-year resistance level in June could act as a powerful technical catalyst. Such a breakout often signals to traders that the previous downtrend or consolidation phase is over and a new uptrend is beginning. This can trigger a cascade of buying activity:
• Algorithmic traders: Automated systems programmed to buy on such breakouts would activate.
• Momentum traders: Those who follow trends would jump in, anticipating further upside.
• Retail investors: Seeing a strong upward move and positive commentary from technical analysts, many would enter the market, driven by FOMO.
This self-reinforcing cycle of buying pressure can lead to rapid price appreciation. A clean break above a well-established resistance, confirmed by high trading volume, would shift trader sentiment dramatically. The narrative would change from "XRP is stuck" to "XRP is finally on the move." In the world of crypto, where sentiment and momentum play such crucial roles, a technical breakout of this nature could readily propel XRP towards a 50% gain as it seeks new, higher price ranges.
Part 2: XRP Price Prediction for 2040: A Pathway to Quitting the 9-to-5?
Shifting our gaze from the immediate horizon of June to the distant future of 2040 requires a different kind of analysis, one steeped far more in broad secular trends and ambitious possibilities than in specific, near-term events. Predicting the price of any asset, let alone a cryptocurrency, over a 15+ year timeframe is an exercise in informed speculation. However, by considering the fundamental goals of XRP and the potential evolution of the financial world, we can explore what might need to happen for XRP to reach a valuation that could allow its holders to achieve financial independence.
Factors Influencing XRP's 2040 Price:
For XRP to achieve a truly transformative price by 2040, several significant, long-term developments would likely need to occur:
• Global Adoption of Ripple's Payment Solutions: The cornerstone of XRP's potential long-term value lies in the widespread, global adoption of RippleNet and its associated services, particularly ODL. If, by 2040, Ripple's technology becomes a standard, or at least a major player, in facilitating international payments for banks, financial institutions, and multinational corporations, the demand for XRP as a bridge asset would be immense. This implies successfully navigating complex regulatory landscapes across dozens of countries and outcompeting both legacy systems and emerging alternatives.
• XRP as a Dominant Bridge Currency: Beyond RippleNet, XRP's utility as a neutral, efficient bridge asset between various forms of value – different fiat currencies, other digital assets, and potentially even Central Bank Digital Currencies (CBDCs) – would need to be firmly established. If CBDCs become prevalent, the need for interoperability and seamless exchange between them could create a significant role for assets like XRP.
• Comprehensive Regulatory Clarity and Supportive Global Frameworks: The current patchwork of crypto regulations globally would need to evolve into clear, supportive, and harmonized frameworks that recognize the utility of digital assets like XRP. This would foster greater institutional confidence and pave the way for mainstream integration.
• Overall Crypto Market Maturation and Growth: The total market capitalization of the entire cryptocurrency asset class would likely need to grow by orders of magnitude. If digital assets become a more integral part of the global financial system, the valuations of leading utility-focused projects like XRP could rise substantially.
• Sustained Utility and Network Effects: Continuous innovation within the Ripple ecosystem, expanding use cases for XRP, and strong network effects (where each new participant adds more value to the network) would be crucial. This includes the ongoing efforts of the XRP Ledger community to enhance the technology and foster new applications.
• Tokenomics and Scarcity: While XRP has a large total supply, if its utility drives consistent and growing demand, and if a significant portion of the supply is locked up in active use (e.g., in payment channels or DeFi applications on the XRP Ledger), relative scarcity could contribute to price appreciation.
What Price Would Enable Financial Freedom?
The dream of "quitting your 9-to-5" is deeply personal and depends entirely on an individual's financial needs, desired lifestyle, and the amount of XRP they hold. There's no magic price number for XRP that universally guarantees financial independence.
Let's consider some purely hypothetical scenarios, without suggesting these are likely outcomes:
• If an individual desires an annual income of $100,000 to live comfortably, and they aim for a conservative 4% withdrawal rate from their investments, they would need an investment portfolio of $2.5 million.
o If they held 100,000 XRP, the price of XRP would need to reach $25.
o If they held 1,000,000 XRP, the price would need to be $2.50.
• For a more modest early retirement, say needing $50,000 annually, the portfolio requirement would be $1.25 million.
o With 100,000 XRP, the price target becomes $12.50.
o With 1,000,000 XRP, the target is $1.25.
These are simplistic calculations. A truly transformative price for XRP, one that creates generational wealth for early adopters holding substantial amounts, would likely need to be in the double or even triple digits per token. This would imply XRP capturing a very significant share of the global cross-border payments market, a market valued in the tens of trillions of dollars annually.
It’s also important to consider that "quitting the 9-to-5" doesn't just mean cashing out a lump sum. If the XRP ecosystem evolves to offer reliable staking or yield-generating opportunities, holders might be able to earn a passive income from their assets without selling them, providing another path to financial independence.
The "Quit Your 9-to-5" Dream: Possibilities and Pitfalls
The allure of turning a modest crypto investment into a life-changing sum is a powerful motivator. For XRP, the vision of frictionless global payments is compelling, and if realized, could indeed propel its value to extraordinary heights by 2040.
However, the path to such a future is fraught with immense risks and uncertainties:
• Market Volatility: The cryptocurrency market is notoriously volatile. Even if the long-term trend is upward, there will likely be severe bear markets and periods of stagnation along the way.
• Regulatory Headwinds: While clarity is hoped for, adverse regulations in key jurisdictions could severely hamper XRP's adoption and value.
• Technological Disruption: The technology landscape changes rapidly. A new, superior technology for cross-border payments could emerge, displacing Ripple and XRP.
• Competition: Ripple faces competition from established players (like SWIFT, which is also innovating), other blockchain projects, and emerging fintech solutions.
• Execution Risk: Ripple's ability to execute its vision, build partnerships, and navigate global complexities is not guaranteed.
• Black Swan Events: Unforeseen geopolitical, economic, or technological events could dramatically impact the crypto market.
Therefore, while dreaming of a 2040 where your XRP holdings allow you to bid farewell to traditional employment is enticing, it must be tempered with a strong dose of realism. Relying on any single speculative asset for one's entire financial future is highly inadvisable. Diversification, continuous learning, and prudent risk management remain essential principles for any investor.
Conclusion: Navigating XRP's Present and Future
XRP stands at an interesting crossroads. In the near term, as we look towards June, specific catalysts like legal breakthroughs, major partnerships, broader market rallies, or technical breakouts could indeed provide the impetus for a significant price surge. The potential for a 50% gain, while speculative, is within the realm of possibility given the right confluence of events.
Looking further ahead to 2040, the vision for XRP is far grander, but also far more uncertain. Its ambition to reshape the landscape of global payments is immense. If it achieves even a fraction of this ambition, its value could be substantially higher. Whether this translates into "quit your 9-to-5" money for its holders depends on a multitude of factors, many of which are currently unknowable.
The journey of XRP, like that of the broader cryptocurrency market, will likely be a rollercoaster of triumphs and setbacks. For those invested, or considering an investment, it requires a blend of optimism for its potential and a clear-eyed understanding of the risks involved. Whether for a short-term trade or a long-term hold, due diligence and a sound investment strategy are paramount. The future of XRP is yet to be written, but its ongoing story is undoubtedly one of the most compelling in the digital asset space.
XRP forming a giant inverse head and shoulders patternA lot of people are bearish right now, but I remain bullish. XRP is forming a very large inverse head and shoulders pattern. I believe the breakout will be massive when it finally goes. CRYPTOCAP:XRP

XRPU short termIn short term if break up line 2.150 then next target 2.200.For my opinion now we like earlier i say still in bearish trend.

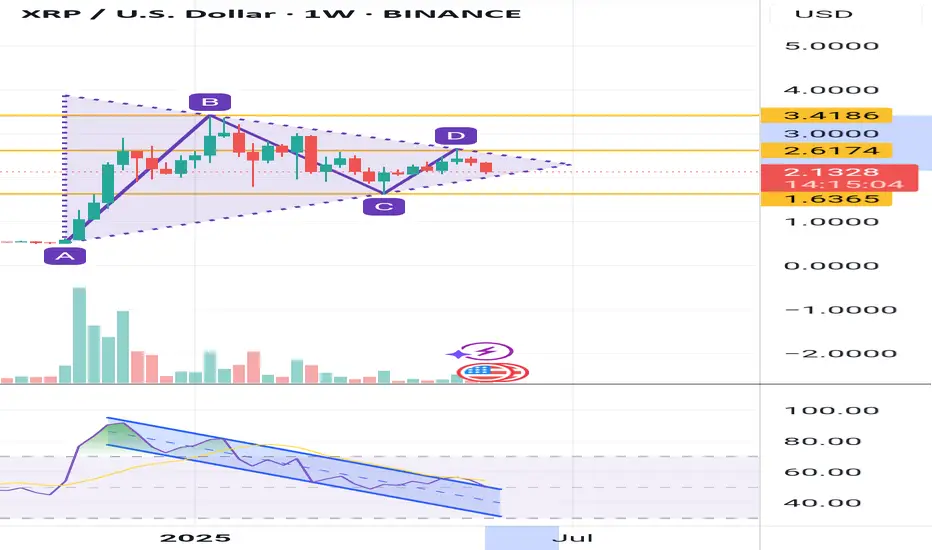
XRP (Daily) Complex Correction WXYXZXRP appears to have a complex correction underway with a series of ABCs in a descending channel after reaching all time high.
Price is just above the 61.8 Fibonacci retracement and high volume support node which is likely to test at $1.95.
Analysis is invalidated if price breaks above wave X swing high.
Ultimately it is trapped in a large range.
Safe trading

Xrp price.Xrp weekly rsi is breaking the channel . If it breaks the channel and xrp break the weekly triangle , in the next month we might see 60% increase in price.