iExec RLC | This Wave Can Be Much Stronger... Why People Trade!Notice the early 2024 bullish wave; it is small and also short-lived. This is understandable because Bitcoin was going up strongly and this tends to absorb all of the energy that is in the market. It doesn't matter what the situation is, Bitcoin shines because Bitcoin is the name of the game.
Back
Related coins

Textbook c-fork breakout, 50ma reclaimYou can see that the price found support on range low, broke the c-fork trendline, reclaimed 50DMA. I think this will run from now on.

RLCBTC Trading Signal: Action RequiredDear Traders,
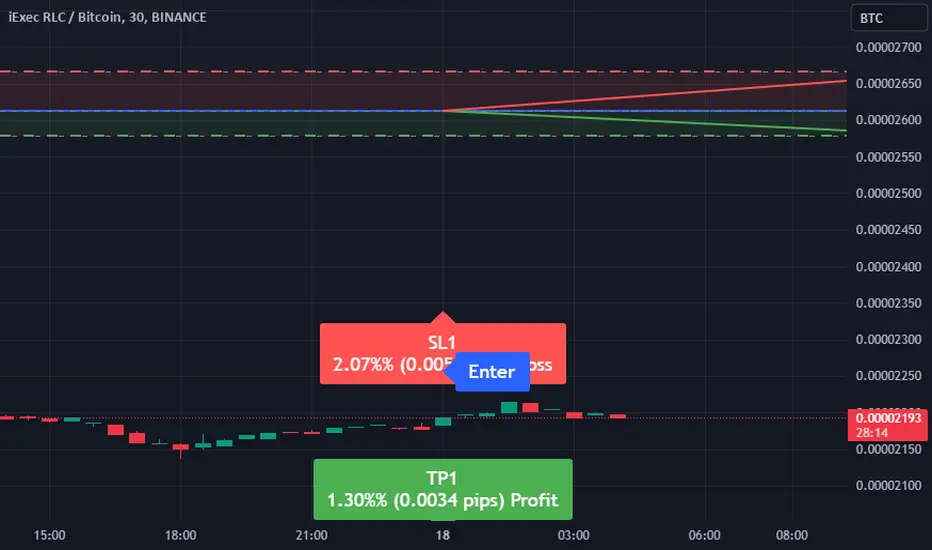
Our analysis indicates a potential opportunity to Sell the RLCBTC pair. Here are the specifics of the signal:
Direction: Sell
Enter Price: 2.612E-05
Take Profit: 2.578E-05
Stop Loss: 2.666E-05
Using our EASY Quantum Ai strategy, we have identified key factors supp
iExec RLC | This Wave Can Be Much Stronger... Why People Trade! Notice the early 2024 bullish wave; it is small and also short-lived. This is understandable because Bitcoin was going up strongly and this tends to absorb all of the energy that is in the market. It doesn't matter what the situation is, Bitcoin shines because Bitcoin is the name of the game.
Back

RLC/BTC - iExec RLC: SuperTrend BBand Breakout◳◱ On the $RLC/ CRYPTOCAP:BTC chart, the Supertrend Bband Breakout pattern suggests an upcoming trend shift. Traders might observe resistance around 0.00004961 | 0.00006085 | 0.00008093 and support near 0.00002953 | 0.00002069 | 0.00000061. Entering trades at 0.0000428 could be strategic, aiming fo

✳️ iExec | Four Years Of Higher Lows (500% Potential Or More)➖ RLCBTC hit bottom 2019.
👉 From this 2019 bottom a 1,230% bullish wave developed.
➖ RLCBTC hit bottom 2021, as a higher low compared to 2019.
👉 From this 2021 bottom a 1,400% bullish wave developed.
➖ RLCBTC hit bottom 2022, no strong bullish wave noticeable, still a higher low.
➖ RLCBTC hit bot

RLC Yearly Cycle RLC Yearly Cycle Trend here looks obvious as to where the market and RLC are heading.

A little RLC can go a long way IExec RLC/BTC
I spent yesterday evening looking for tokens/coins that have outperformed or kept on par with their BTC valuations.
The obvious ones are MATIC and ETH but I'm looking for other smaller hidden opportunities in the charts.
I cam upon RLC, and it might be worth keeping an eye on thi

RLCAs we can see, this currency is in a daily main ascending channel and an ascending secondary channel. The monthly MACD indicator is positive, which is very good. In my opinion, the best buying point is around 0.000066. Good luck

Long term idea on RLCBTCMy first HODL idea. Please provide your thoughts BINANCE:RLCBTC
SELL 75pct at 30000 sat
SELL the rest at the rest at 100k sat

See all ideas
Summarizing what the indicators are suggesting.
Oscillators
Neutral
SellBuy
Strong sellStrong buy
Strong sellSellNeutralBuyStrong buy
Oscillators
Neutral
SellBuy
Strong sellStrong buy
Strong sellSellNeutralBuyStrong buy
Summary
Neutral
SellBuy
Strong sellStrong buy
Strong sellSellNeutralBuyStrong buy
Summary
Neutral
SellBuy
Strong sellStrong buy
Strong sellSellNeutralBuyStrong buy
Summary
Neutral
SellBuy
Strong sellStrong buy
Strong sellSellNeutralBuyStrong buy
Moving Averages
Neutral
SellBuy
Strong sellStrong buy
Strong sellSellNeutralBuyStrong buy
Moving Averages
Neutral
SellBuy
Strong sellStrong buy
Strong sellSellNeutralBuyStrong buy
Displays a symbol's price movements over previous years to identify recurring trends.