RLC BTC #RLCBTC (Short Term)
Buy: 0.00007113 - 0.00006757
Target 1: 0.00007326
Target 2: 0.00007611
Target 3: 0.00008180
Target 4: 0.00009247
Target 5: 0.00010670
Stoploss: 0.00006588
Invest: 3%
Risk/Reward: 5% / 54%
RLCBTC trade ideas

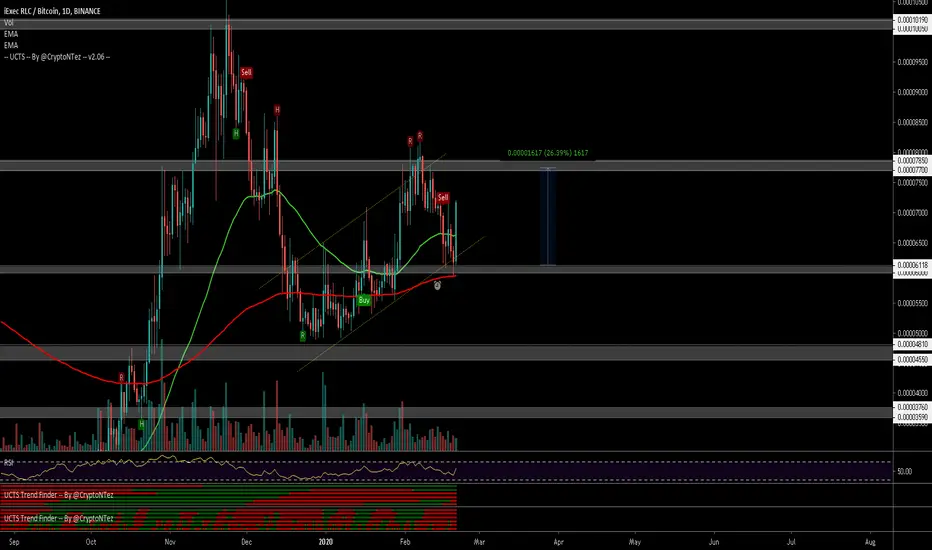
$RLC, Testing lower trendline of the ascending channel...$RLC
Testing lower trendline of the ascending channel (matching ~6100 sats support level & EMA50)
If it bounces from here (showing some rising volume), then a new test of 7700 sats could be in play (over 20% in price increase)
#RLC
RLCBTCUpdate: worked out well. Taking profit... waiting for a daily close to observe if there is still some room. But we are in desperate need for a retrace, coin is tired.
Btw. Tradingview now lets you see the close on all timeframes

RLC ANALYSIS (LONG OPPORTUNITY TO FILL THE HANDLE!)RLC is expected to form a cup and handle formation here as RLC hits the previous local support from the past years. RLC has seen a significant retrace and is expected to bounce from here to the 200 MA with an entry zone of 4200-5200 sats. It seems the reversal has already started therefore the chance of the lower end of the entry zone, near the 200 MA, will not likely be hit. I expect a rise to 100 MA at 6000 sats. Followed by 50 MA at 6990 sats. The handle will completely form after T3 and T4 successfully fill topping out at over 9000 sats. As long as BTC dominance doesn’t eat up the market, this setup is prime for long term success! Any stop loss should be set below the 200 MA as this invalidates the formation.
Possible Entries: 4200-5200 sats

#iExec RLC | Good Move Before Take OffA currency #RLC has witnessed a strong rise in the previous months and is now in the process of correcting the wave, which reached 560%
We expect from this region to take the price up again
Do not hurry to buy, the price may go down to good places
Do not risk a large amount of your money
Please share your opinion in the comments box and do not forget to press the like button
Add to watchlist

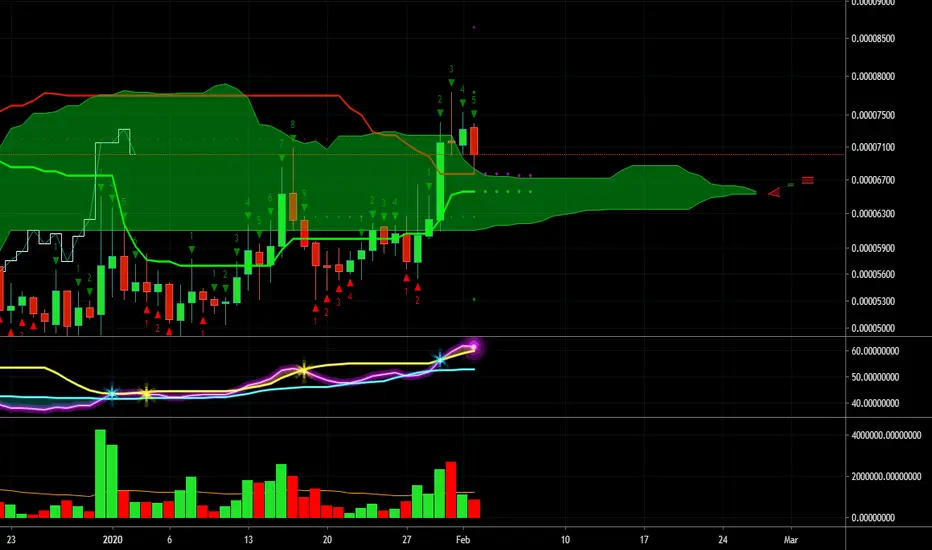
BULLISH on RLCRLC has a kumo -restest on the daily which went all the way down to the Kijun and is bouncing!
Very bullish setup and moved in at 7000 sats looking to TP at 8200.
Stop below kijun.
Trade, Chart, Learn, Repeat
Coach K
$RLC, Moving inside an ascending channel on the 1D$RLC
Moving inside an ascending channel on the 1D
Recently tested upper trendline & now retracing a little..
If pattern is kept, then a new retest of support should happen
On the other side, breaking from this channel should allow a leg up with target at ~10k
Set alerts!
#RLC


RLC/BTC - Round 2After finding support at the 0.618 and consolidating for a few weeks, I believe RLC is ready for another leg up.
My reasoning:
Location/structure: Strong support and nice structure "W" at the 0.618
Divergence: Confirmed histogram div, RSI looking good. Willy coming out of stupid. Strong OBV
VPVR: Lots of volume traded at this level
I should note there is a lot of unresolved business below. The 3300 - 5000 sat range has been a very weak area for the bulls in the downtrend, and for the bears in the uptrend. Right now, I'm not too concerned as the OBV gives us a nice bullish case in the short-medium term.
Hit the LIKE button if you like my analysis and want to support my channel. Follow to make sure you don't miss any future trade ideas.


$RLC, Crossing above ~6100sats resistance level with volume..$RLC
Crossing above ~6100sats resistance level with some volume (not great)...
Crossing above EMA50/200 on the 1D chart with UCTS Indicator signaling an earlier buy signal..
I'm looking for a potential R/S Flip as entry at this level with target at ~7K sats (20%+)
#RLC

iExecRLC (Jan 13) - 56% in 17 Days#RLC/BTC (Binance)
Buy : 5600 - 5700
Sell : 6000 - 6250 - 6500 - 7000 - 7500 - 8000 - 8600
Stop : 4950
#RLC $RLC #RLCBTC

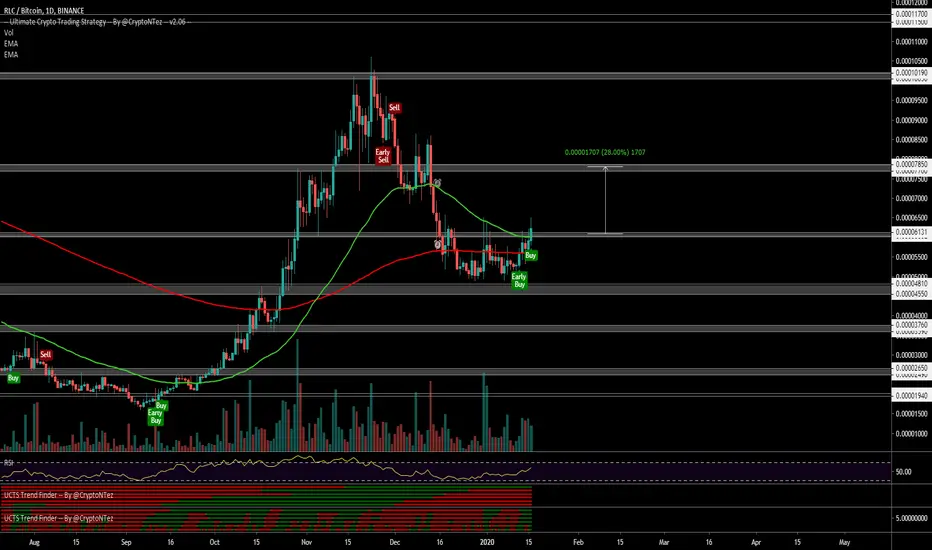
RLC/BTC TA Update (Long Term Bullish Pattern?)RLC/BTC
Looking at the bigger picture of RLC, this is technically bullish as long as the price can hold the 200 Day MA in the coming weeks.
But RLC's number 1 enemy right now is the downward trend-line resistance
which keeps the price respecting it from the peak High 10k sats area.
If RLC breaks this trend-line, form a new Higher Low and consolidate within the bullish buying area.
I wouldn't surprised to see further growth or retest previous High at 10k in the future.
Bearish scenario if the price closes below 200MA that will signal the pullback hasn't done yet and we could see the coin drop to 2.5k sats area.

RLCBTC Bullish Cup & Handle Updates & Targets 200%#RLCBTC Cup & Handle Pattern Chart Updates:
I told you about this bearish scenario So you saved your fund.
and I hope you are waiting for Best Buy entry.
according to my chart analysis Best Entry will be 4500 Satoshi.
But but keep an eye on chart also guys.
if 4500 Satoshi level also breakdown then free fall till 3500 Satoshi .
And my next level for entry will be 3000-3600 satoshi .
So guys you also follow my Twitterrrrr for each and every crypto Updates.
and in short term I will say scenario of RLCBTC
Now my key level for buy:
Support-1
&
Support-2
if Breakdown Support-1 then exit and wait for Next Level of Support-2 and
If our any entry filled before breakout then our Target after Breakout:100%-200%
so keep an eye on our every updates.
Stay tuned


RLCBTC Cup and HandleCup and handle formation.. cryptocurrencies tend to be pretty uneasy with these patterns. Included a small Fibonacci retracement

RLCBTC Cup&Handle Pattern like #LEND/BTC 300% within weekRLCBTC Now Looking Very Bullish in Weekly Time frame.
If This will break out handle trundling then our Target will be very Big like 200%.
and
and
and If not breakout upper side Trendline then we placed Bid for Buy around 4400 Satoshi and 3500 Satoshi.
This is strongly Buy zone.
50 Day moving average is Working a strong Resistance at 5961 Satoshi.
If weekly candle close above 5961 Satoshi then we are extremely Bullish and our Target will be 100% and 200%.
and also keep an mind
in weekly candle 30 days MA is Strong Support at 4408 Satoshi.
so our first buy Zone will be 4000-4408 Satoshi.
and 3500 Satoshi is Very Strong Support if break down 30 days MA support.
but we are Trader so keep an mind also MACD in weekly Time frame is Not good.
This indicates bearish sign mean Some Retracement.
so I can prepare for My 2 Buy zone.
Wait for 1st buy zone if fill then keep an eye on chart. if bullish then set sell targets and if bearish then wait for 2nd Targets.


$RLC C&H forming on daily. Looking for R/S flip @ .618 fib levelCup & Handle pattern forming on $RLC. Currently retesting previous resistance as support-right around the 0.618 fib retracement level. Daily MACD bull cross in the works. long 5000-5075

RLCBTC 1D RLC Now Fib 61.8 Golden Ratio+Support Zone Test. If This Break The Level Next Support Zone 200MA Daily
Support Zone
1-61.8 fib
2.200MA Daily
3.3700-3800Sat

iExecRLC Starts To Bounce | Easy 41% Mapped! iExecRLC (RLCBTC) was one of the first altcoins to go bullish this past summer and this one produced amazing results for us, we have been looking at this altcoin project/pair for years.
Here is an example:
Now, I am taking a closer look and looking at this short-term.
iExecRLC (RLCBTC) on the 4H Timeframe
First, we can clearly see volume going higher as EMA10 is broken and EMA50 challenged.
Strong bullish divergence is now active on both the MACD and RSI.
The RSI is now really strong reaching almost 60.
The red dashed line where RLCBTC found support, is also te 0.786 Fib. retracement support for the complete bullish wave that took place after the early Sept. '19 low was hit. Increasing the odds that this is where the bounce will take place.
Here is the full chart on the daily timeframe:
Conditions for change
If the last low is broken at 0.00004948, the above signals become invalid and a new analysis is needed. Always make sure to have a plan before you trade with an in and out strategy.
Thanks a lot for your continued support.
Namaste.
