RLCBTC trade ideas

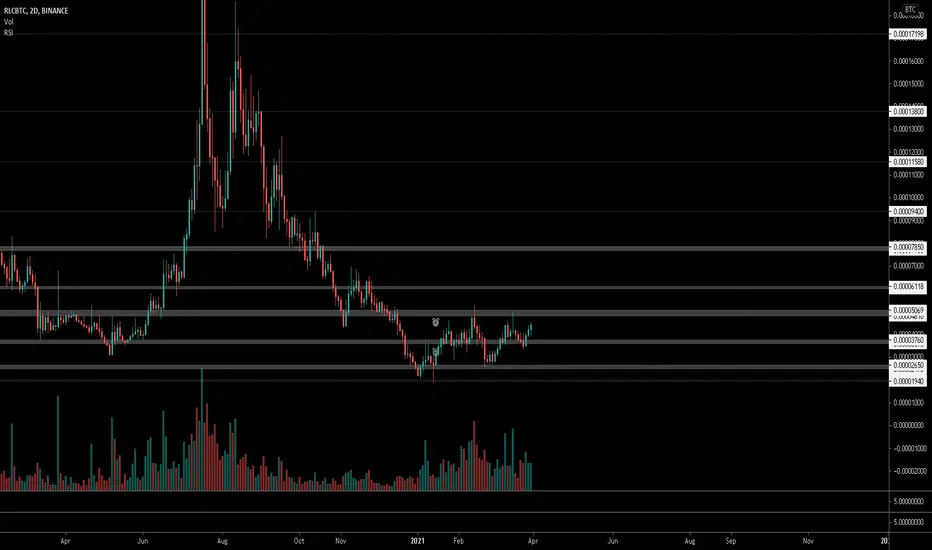
$RLC, Showing really strong volume$RLC
Showing really strong volume not seeing since mid '20 as its going for a second try at ~5k sats level
Still riding this one since the UCTS 2D Buy signal..
Volume usually preceeds price.
Looking for a flip or straight volume as signal of continuation 🍀🤞
#RLC


Rlc/BtcThe graph looks good if it breaks the yellow resistance zone, it will have entered the triangle and will likely rise to the next yellow resistance line.
#Hodl

RLC/BTC Inverse Head and Shoulders accumulation patternRLC BTC pair is painting a large Inverse Head and Shoulders accumulation pattern spanning ~1060days to date.
Expected break out and measured move of ~790% @ ~45615sats


RLC is about to EXPLODE!!!!!!Rlc/btc hast just crossed the 200 daily Moving average .As you can see every single time we break it we had a least pump of 100% this time could just be similar unless btc dumps promptly .With btc dominance heading into lows more money is going to flood in altcoins and rlc is about to do something big .however its for the best to wait for btc to settle down then buy in a position.
Make sure to like and follow
No financial advice do your own research. cheers!

$RLC, Catching up with the market..$RLC
Catching up with the market..
2D Buy flashing w/ increasing volume..
Willing to see if its able to break from current range above ~5k sats
#RLC

70% for RLC soonYOUR LIKE OR COMMENT IS MY FUEL FOR NEXT ANALYSIS :) IF U HAVE ANY QUESTION REACH ME HERE
This is not a financial advice. Always do your own research and always put stoploss in your trade (SL) :) If you want more detailed info
how to study and read charts or just need help with some coin, just write to me here a comment, i will try to answer to everybody...
i can help you :) all for free, don't worry, BE HAPPY!


RLCBTC LONGRLC hase been stablised abov sma100 and hase potentian to grow for 25% more . the first target could be the crosiing value at sma200
I also see the 5th eliot wave in 24h time frame forming in RLCUSDT wich can grow the price

RLC is ready for doubleYOUR LIKE OR COMMENT IS MY FUEL FOR NEXT ANALYSIS :) IF U HAVE ANY QUESTION REACH ME HERE
This is not a financial advice. Always do your own research and always put stoploss in your trade (SL) :) If you want more detailed info how to study and read charts or just need help with some coin, just write to me here a comment, i will try to answer to everybody... i can help you :) all for free, don't worry, BE HAPPY!


RLC/BTC READY WITH 500% BULLISH POTENTIALRLC/BTC
Current Price = 0.00003521
Pump Potential = 500%
Period = 30 to 90 Days
All targets and stop loss already mentioned in the above chart
You can take an entry in it for a very good profits
Technical Analysis
1. RLC/BTC break its huge falling channel
2. Trying to breakout symmetrical triangle after breaking descending wedge
3. Bullish Trend line on RSI
4. Trading above 50 at RSI
5. It continuasly makes higher lows after a long falling trend
6. Golden Cross (50EMA Cross over 200EMA at 4H chart)
7. Trading above 200EMA at 4H Chart
8. Retest from All Time Low which is a very strong support
Thanks & Happy Trading


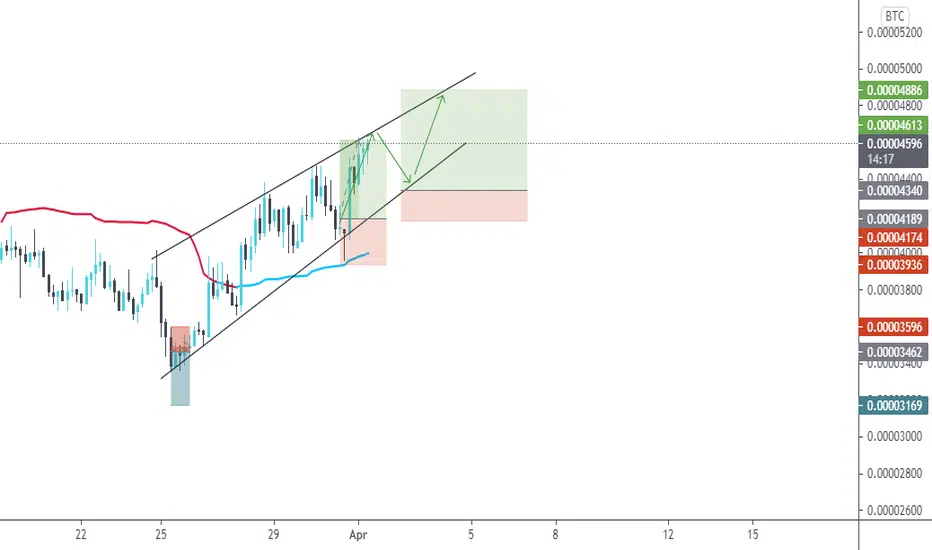
The best situation for Long Hi guys i hope u enjoy this analysis
The best situation for long
We broke the trend line we can get 100% easily
Just hold (SPOT)
If we break strong RESISTANCE zone we can go to moon nicely
Good luck
Tnx for supporting us

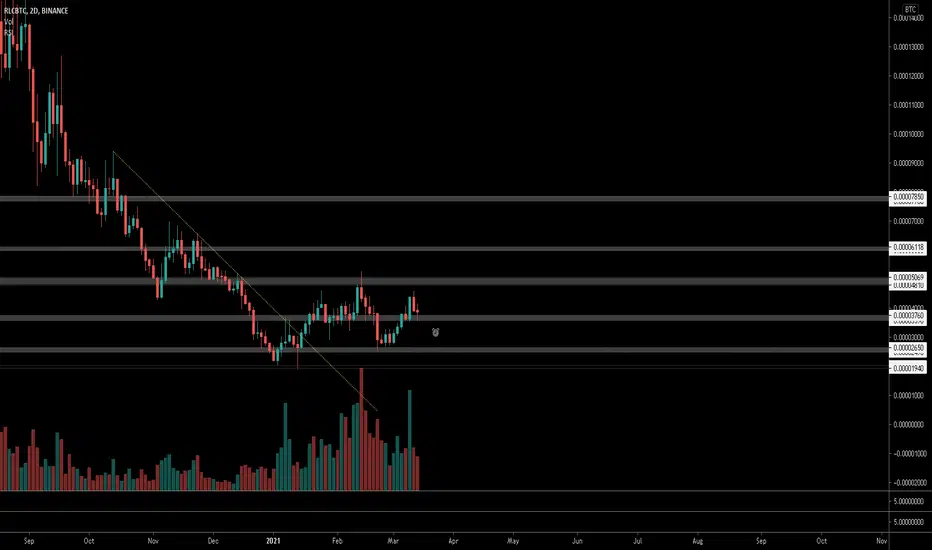
$RLC, Crossed over ~3700 sats...$RLC
Crossed over ~3700 sats & now trying to flip it into support on the 1D chart
Willing to see if it can gain momentum / volume and starts pushing up from here
Alts are overall looking bullish against BTC and UCTS is signalling a 1D Buy on this one
Let see how it goes
#RLC
RLC/BTC - Trading in the big channel +300%Hello everyone, analyzed the RLC/BTC pair
I love to trade triangles like this. Because at 95% the price returns very well, at least half of that drop.
Moreover, on a shorter timeframe, there are bullish diverters, as well as indicators indicate a price reversal
Target: Fibo grid, potential top loss and risk management - it all depends on your trading system.
"This is just my opinion, trade with your trading system."
"Have a nice day everyone and comeback again."
