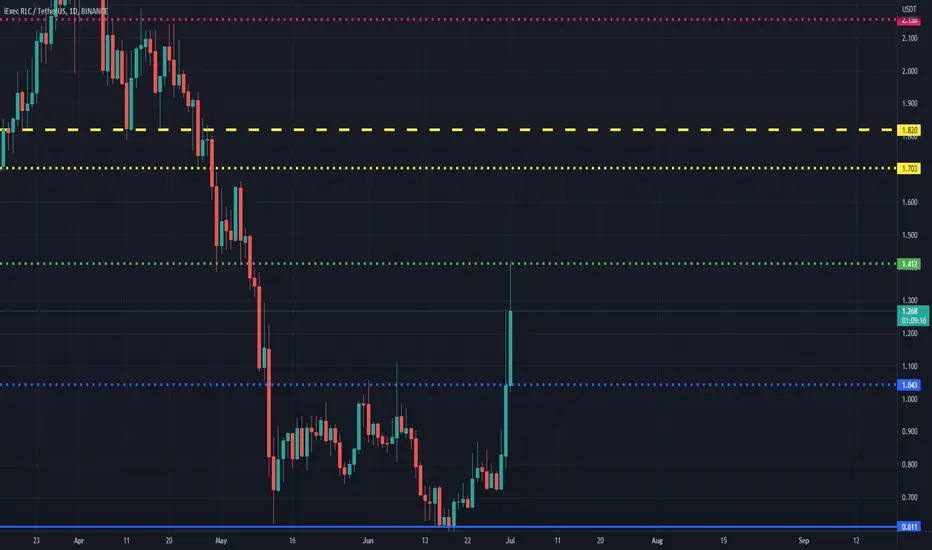
RLC 2nd Entry Point to Long 20220705It is a good entry point to long, 2nd chance
Risk Reward 3 - 5, 5 * N might be a bit much, take profit when it reaches 3 *N
RLC , iExec, RLCUSD , RLCUSDT ,RLCUSDTP, BITCOIN ,CRYPTO,CRYPTOCURRENCY
DISCLAIMER
This is only a personal opinion and does NOT serve as investing NOR trading advice.
Please make your own decisions and be responsible for your own investing and trading Activities.
RLCUSDT trade ideas

RLC RLC looks wont go up for awhile
need a bigger correction I think unless we break 2.650 level and have a correction there

RLCUSDT - Short by Supertrend, Pivot & ADX 7/14/2022- 4h timeframe: Supertrend indicator > Short.
- 1h timeframe: Supertrend, Pivot High/Low & ADX indicators.
... Pivot High/Low: Lower High occurs before Lower Low for Short.
... ADX > 25: strong trend.
... Wait to a rejection at Supertrend 1h timeframe for open a Sell.

RLC bullishRLC is holding 0,618 of fibbonaci retracement and it can be pretty big in next days. looks bottomed.

Waiting for descendingTechnically.
We have an 56 days of accumulation after downtrend. After up edge of the zone breakdown we came back into. Therefore RLCUSDT is nog willing to start a new uptrend. Form the other side, global BTC benchmark in nearly to start new uptrend, but RLCUSDT is looking for downtrend. We expect downtrend for the pair of RLCUSDT, but we would like to wait for a solid entrance. Meanwhile some stop-orders could be placed below the current price...

Short RLCUSDT After whose many population and pump RLC is losing is strength there will be strong fall after 0.9935 level break shot it and wait take profit target point 0.8255 , 0.7760

RLC gib dump plsWorth the risk imo, we can go higher but not much, still I m ussing a smaller leverage than the usual

🔥 RLC Fibonacci Reversal: Will The Trend Continue?RLC has been on a massive run last week. However, since topping around the $1.4 area RLC saw a 30% decline all the way back to $0.98
If we draw a Fibonacci retracement, we can clearly see that the 0.618 retracement is right on $0.98, so strong support was expected there.
If can see more bullish/neutral price action from BTC I think that RLC is going to form a lower high somewhere between $1.2 - $1.3 in the near future. A bearish BTC will make it more difficult, but still plausible.

RLC/USDTBuy the dip with horizontal S/R, EMA 200 (1h), Fib 0.618 golden pocket.
Target 1.15 Fib 0.38 and 1.25 Fib 0.618
Stop: 0.88

RLCUSDT :: Important WarningRLC-USDT pair tends to go down, so you should be ATTENTION!!!
If levels between 1.143 - 1.133 is broken and the price stays below it for 4 hours, so the price may go down and downtrend continues to the specified levels on the chart.
It can return to the uptrend if it passes level 1.218 and remains above it for 4 hours.


[grey master] RLC downbitcoin will crash and all altcoins will plummet. Especially shit coin glc is being manipulated and will drop heavily soon

RLCUSDTPERPBy drawing the support and resistance line, when it hits the support line, we expect the price to grow up to the resistance line

RLCUSDT (IEXEC) Daily tf Range Updated till 01-07-22RLCUSDT (IEXEC) Daily timeframe range. this one actually a bit of interesting alt. its not fundamentally superior compare more to many other higher #mcap assets. but it can offers some rewards to anyone who want to bet with the risk. there are retests which offered some quick reward for scalper there were it didn't, of course i saw this alt been pump and dump by some telegram channels. those things got effects on price action and peoples that holds. it was not easy to chart it either cause of some unusual out of places moves but who to blame as it was when quality of holders are not that high.
RLC - THE BIG SHORTHi, everything is on the chart. This coin pumped out of knowhere almost 100% in 2-3 days. When you see such a thing you need to follow by the rule "what goes up very fast, must goes down". Of course you need to keep an eye on founding rate because when there is a lot of short positions, casino (i mean exchange here) does not like when shorters are winning so you need to keep stop loss. Otherwise there might be fake pump that will clean up shorters and you are liquidated. Watch out on that. Seen a lot of these situations before. Take care.

RLCUSDT maybe my saturday or sunday trade . Short entry All the market is clearly red for a long time ... and it will continue at least still summer.
RLCUSDT look like not at the same level than other crypto today.
A bit to high ?
I will watch for short signal.
If the 4th conditions are in ligne i will open a short with the differents target on the view.

RLCThe price is trying to break through the upper border of the channel, 200 MA and the local trend line. I think it's too much resistance. The growth area is indicated in case of breaking through the resistance

RLC short position1HR OB ✅
Liquidity grab ✅
retest to the previous high forming divergence thats a possible price will go down.

📊 RLC pumped more than 30% today! What's next?Hello, dear TradingView members.
This idea is an RLC analysis.
RLC just pumped more than 30% and got rejected by the upper Bollinger Band.
The rejection wasn't that powerful that's why it's still moving in the short-term ascending channel and we might see a retest any hour now.
There are two support levels on the chart holding the price up, and two resistance levels pushing down on value.
There are two possible scenarios.
Scenario One:
The price will gather more buy volume and after moving near the support level it will pump to the potential target zone.
Scenario Two:
The price will lose strength. Then it will be rejected by the resistance level, and fall on support.
The Speedometer indicator shows Buy volumes on the market for RLC on a 1D interval.
Now have in mind: ANY news about this coin can cause a big pump or dump at this moment!
Let me know if you guys have any questions;
I will be more than happy to help.
Good luck, and thank you.

RLC - will update high✈️Reasons to take long:
⭐️ BTC made a pullback
⭐️ Over VWAP
⭐️ Coin in game
⭐️ Close to local high
⭐️ Pullbacks are getting smaller
⭐️ 4th touch
Will enter when price squeezes to the trendline on 5m timeframe, the base will form and the tape will get faster.
If you don't understand the previous sentence, just use swing stop-loss 3-5%
Fix profit by parts:
2% - 1/3
4% - 1/3, stoploss to breakeven
What's left, hold to the maximum
What do you think of this idea? What is your opinion? Share it in the comments📄🖌
If you like the idea, please give it a like. This is the best "Thank you!" for the author 😊
P.S. Always do your own analysis before a trade. Put a stop loss. Fix profit in parts. Withdraw profits in fiat and reward yourself and your loved ones

RLC USDT Happy trading
HELLO GUYS THIS MY IDEA ABOUT RLC Usdt is nice to see strong volume area....
Where is lot of contract accumulated...
I thing that the Seller from this area will be defend this SHORT position...
and when the price come back to this area, strong SELLER will be push down the market again...
DOWNTREND + Support from the past + Strong volume area is my mainly reason for this short trade....
THANKS
TURTLE TRADER🐢

RLCUSDT is ready for a new bullish impulse?The price had a bounce from the monthly support on 0.65$ and created a breakout from the daily resistance on 1$
now the price is testing another important resistance on 1.140$.
How to approach?
The price could create a retracement on 0.5-0.618 Fibonacci level to get new liquidity and create a new bullish impulse, so if the price is going to have a breakout from the 1.2$ resistance, According to Plancton's strategy , we can set a nice order
–––––
Keep in mind.
🟣 Purple structure -> Monthly structure.
🔴 Red structure -> Weekly structure.
🔵 Blue structure -> Daily structure.
🟡 Yellow structure -> 4h structure.
–––––
Follow the Shrimp 🦐

RLC/USDT Medium-term work Secondary trend. Triangle areaTimeframe 1 day. Secondary trend. The main trend is clearly upward, which formed a channel. The price is at its lower zone (the green line of the main trend). The coin has been in an uptrend since its inception. Not a belief scam, a test of technology, and what will come out of it is another question... To understand the trends, see the linked trading idea of the main trend of this cryptocurrency.
Coin in the coenmarket: iExec RLC
The chart shows the secondary downtrend of this cryptocurrency. This trend has formed a triangle. The price is clamping down. A decoupling is coming soon.
RLC/USDT Uptrend. Channel. Triangle.
