RLC breakout resistance imminent This resistance line will be broken out of for sure, the run from here is going to be very big. I am long.
Weekly looks great too, higher highs + higher lows.
RLCUSDT trade ideas

RLC/USDTThe price is reaching the downtrend line.
If it can break and stabilize at $ 4, it can form a new uptrend
I also see the head and shoulder pattern in Rlc

Rlc update by vicSomeone commented that I should do update on $rlcusd so here it is so for now we broke below the previous uptrend and as you all know support breaks turns resistance and we are trying to retest the resistance so we might get a dump but if price Breaks into that resistance line that will be a change of trend.
Summary;we are bearish for now
Do you guys remember the last update I did on $rlc we dumped as planned
Share
Thanks for reading
GOOD LUCK TRADERS


Rlc #RLC USDT 3H Chart SIGNAL by CryptolernersBD
♻️ Buy After Breakout Upper Trend Line Resistance. Risky Call.


RlcUsdt see divergence in RSIiExec :The First Decentralized Marketplace for Cloud Resources
A decentralized network giving applications access to trusted off-chain computation and data.
A divergence can be seen in RSI this chart and it is ready to move and pump.
With the fall of Bitcoin today, most charts show a reversal, and this decline was promising for this month.
I have drawn a triangle in this chart. If this triangle does not happen, it can make up to 800% profit. (Of course, I do not think this will happen, but there is definitely good growth ahead)
From 2017 until now, it has gone through a good trend and in good fundamentals, it can be seen that it can have multiplied growth in the bull market.
GL
EntryPoint:
3.735
Supports:
3.522
3.076
2.589
Resistance:
3.883
4.259
Targets:
4.788
6.200
8.043
11.639
18.636
HODL:
33.917
46.378
72.672
Take care of your capital and health in these difficult days
GL

rlc cupagain :) cup handle again :) it is amazing
Since the summer of 2020, decentralized exchanges (DEX) have been all the rage and in 2021 developers and investors continue to flock to the sector due to the ease of listing and buying into new projects.
While the method has proved fruitful for many projects, the price performance for iExec RLC (RLC), a blockchain-based decentralized cloud computing network that recently listed on several centralized exchanges, shows that CEX listings still carry the most weight when it comes to initiating price movements.


RLC iExec Long Opportunity 20210915Signal: Blue -> Green
context: Green
Structure Confirmation: Break Through Resistance
RLC, iExec, RLCUSD, RLCUSDT,RLCUSDTP, BITCOIN,CRYPTO,CRYPTOCURRENCY
DISCLAIMER
This is only a personal opinion and does NOT serve as investing NOR trading advice.
Please make your own decisions and be responsible for your own investing and trading Activities.

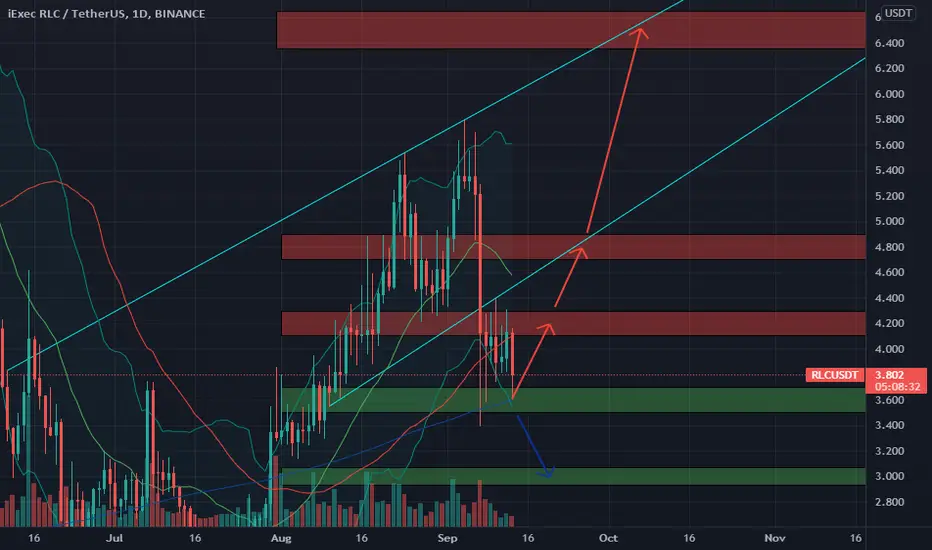
🆓iExec RLC (RLC) Sep-13 #RLC $RLCRLC is continuously recovering from the $3.6 zone and if it doesn't lose this zone, it will rally back to the $4,2, 4.8 and even $3.5 zone in the near term. But if it loses the $3.6 zone, it will fall back to the $3 zone
📈BUY
🔴Buy : 3.5-3.7$. SL if B
🔴Buy : 4.1-4.3$ if A. SL if B
🔴Buy : 4.7-4.9$ if A. SL if B
📉SELL
🔴Sell : 4.1-4.3$. SL if A
🔴Sell : 4.7-4.9$. SL if A
🔴Sell : 6.35-6.65$. SL if A
♻️BACK-UP
🔵Sell : 3.5-3.7 if B. SL if A
🔵Buy : 2.93-3.07$. SL if B
❓Details
📈Red Arrow : Main Direction as BUY and SELL section
📉Blue Arrow : Back-Up Direction as BACK-UP section
🟩Green zone : Support zone as BUY section
🟥Red zone : Resistance zone as SELL section
🅰️A : The Close price of 1-day candlestick is Above the zone
🅱️B : The Close price of 1-day candlestick is Below the zone
RLC Head and ShouldersRLC Head and Shoulders formation slowly forming.
Bullish market so will be interesting to see what happens

RLC kırılım / breakingReds resistance
Yellows supports
2 arrow possible scenarios
Kırmızılar direnç
Sarılar destek
2 ok olası senaryolar

Rlc/usdtRLC SOON BIG PUMPED
GO THE MOON
This analysis is a personal opinion and not a financial recommendation. Subscribe to our channel to support us : bluewolfcrypto

Another Coin Ready To MoveI Share With You All My Trade on RLC. I Think It Can Give us a Good Profit In Short Term.
Not a Finacial Advise


RLCUSDT LONG This is not a financial advise, so do your own research. Guys,There is a cup and handle pattern formation. RLC could break neckline any time.Perfect entry for the long after the neck break confirmation. Target should be the height of the cup around 63.89 %.RSI trend is already in a momentum towards upper side making higher low's. In a nutshell, RLC seems bullish.


RLC about to pumpRLC is a fav of Crypto Inc and looks set to go on another run after a nice healthy correction. Breaking resistance here now and looks very bullish.

RLCUSDT ROUNDING BOTTOMRlcusdt has been trading in a rounding bottom which implies a plausible uptrend reversal to the start of the of downtrend($11.54) and this can only be validated if rlc breaks the dynamic R in yellow trend line. There's a resistance level at $5.34 so a daily close above can ratify an uptrend to the dynamic R, if price fails to break then we should see a reversal to the current resistance level which'd act as a new support level. Be patient enough to wait for daily confirmation.
Your likes and opinions would be much appreciated, you can follow up for more helpful contents and do follow my comment sections too for quick updates.

I WAS DEFINITELY PROVEN WRONG, $RLC UPDATERLC reclaimed the key area as asked, and currently consolidating above, this looks ready for a move upwards to at least those 2 objectives. Didn't give any short trigger as asked, so I was sidelines waiting for some clean PA. Currently spot long from 4.5$ and adding some buy orders below, from 4.5$ to 4$, waiting to get filled. If they get filled, nice, if they dont, nice too. I dont want to see the price close back below 3.85$, thats the line in the sand for me.
