$RNDR bullish momentum? EURONEXT:RNDR is showing signs of life at a major support level.
After a significant pullback, RNDR is finding solid ground in the $2.90 range, a critical area that previously acted as resistance. The 4-hour chart is flashing a bullish divergence on the Stochastic oscillator, suggesting the downwa
Key stats
Related pairs
Render get in earlyI think we finished the abc correction for the wave 4, now just made a 1 and 2? Now gearing up for higher highs.

RENDER - Ready To PopRender is printing a delightful low time frame snowflake.
It is a coiling and very shallow descending channel.
In higher time frame this channel is printing on the 0.786 overshoot ratio of the 1:0.618 with only wicks below:
The 0.786 is a common ratio for a pivot.
And that can potentially comp

Long Render from 3.88 to 6 dollars Double bottom on the daily chart. Weekly divergence in play with strong volume.
Be prepared to buy more at 3.65 zone if we get that chance.
The target is modest as we could be going to exceed the previous top of 11.85 dollar

ALTS Shine, +55% INCREASE !! FTM | RNDR | Render and Fantom have made steep increases over the past two weeks.
In the past two weeks, FTM increased a whopping 55%:
And RNDR increased around the same amount:
This naturally makes it likely to see a correction soon, which may be the ideal time to get into the accumulation boat - or just f

Render!! Aiming for ATHYeah, i see 5 waves up for the wave 3, and i see a abc correction with 5 waves to finish the wave C (end of wave 4) So now entering the last wave. On smaller timeframe you can already see a beautifull Cup and handle reversal pattern. Good luck, trade save, let me know what you think

Buy Render**Buy Render (RNDR)**
The weekly RSI has dropped below 40, signaling oversold conditions and a potential buying opportunity.
Beyond technicals, Render is fundamentally strong:
✅ **Leader in Decentralized GPU Rendering** – The network provides scalable GPU computing power for rendering graph

RNDR (Render); my notes for long-termAs long as the $3.3-3.8 supports are not lost, there is no problem in the long term, it looks good. My close targets are $6.5 and $10. If it stays above $10 and good data continues to come, I will continue to hold and update my targets to 13 - 19 - 24 dollars.
These are notes I write for myself, s

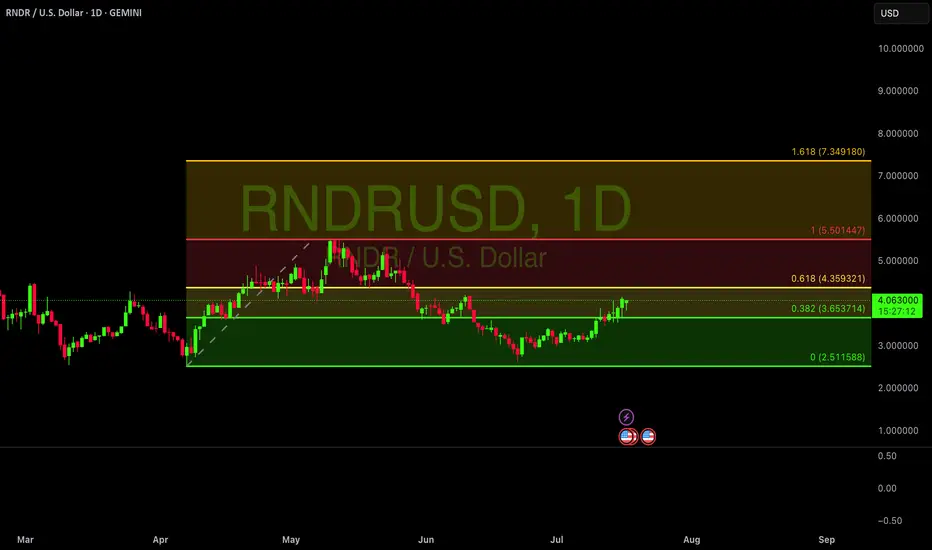
RNDR SHORT/LONGWe had a strong reaction from $3.5, with a bounce of nearly 50%. Currently, the price is at a support level of around $4.1.
From here, the price could either consolidate or gradually move lower toward $3.5, possibly even $3, as the Stoch RSI still has room to go down.
However, a short-term rally t

RNDR bottomFinal rndr fib touch on .786, should see -.27.
seems like an extremely good opportunity to load up

See all ideas
Summarizing what the indicators are suggesting.
Oscillators
Neutral
SellBuy
Strong sellStrong buy
Strong sellSellNeutralBuyStrong buy
Oscillators
Neutral
SellBuy
Strong sellStrong buy
Strong sellSellNeutralBuyStrong buy
Summary
Neutral
SellBuy
Strong sellStrong buy
Strong sellSellNeutralBuyStrong buy
Summary
Neutral
SellBuy
Strong sellStrong buy
Strong sellSellNeutralBuyStrong buy
Summary
Neutral
SellBuy
Strong sellStrong buy
Strong sellSellNeutralBuyStrong buy
Moving Averages
Neutral
SellBuy
Strong sellStrong buy
Strong sellSellNeutralBuyStrong buy
Moving Averages
Neutral
SellBuy
Strong sellStrong buy
Strong sellSellNeutralBuyStrong buy
Displays a symbol's price movements over previous years to identify recurring trends.
Curated watchlists where RNDRUSD is featured.

Metaverse tokens: VR crypto for a VR world
21 No. of Symbols
See all sparks
Frequently Asked Questions
The current price of RNDR (RNDR) is 3.509000 USD — it has risen 1.97% in the past 24 hours. Try placing this info into the context by checking out what coins are also gaining and losing at the moment and seeing RNDR price chart.
RNDR price has fallen by −17.91% over the last week, its month performance shows a 5.13% increase, and as for the last year, RNDR has decreased by −30.17%. See more dynamics on RNDR price chart.
Keep track of coins' changes with our Crypto Coins Heatmap.
Keep track of coins' changes with our Crypto Coins Heatmap.
RNDR (RNDR) reached its highest price on Mar 18, 2024 — it amounted to 14.030000 USD. Find more insights on the RNDR price chart.
See the list of crypto gainers and choose what best fits your strategy.
See the list of crypto gainers and choose what best fits your strategy.
RNDR (RNDR) reached the lowest price of 0.272000 USD on Jun 18, 2022. View more RNDR dynamics on the price chart.
See the list of crypto losers to find unexpected opportunities.
See the list of crypto losers to find unexpected opportunities.
The safest choice when buying RNDR is to go to a well-known crypto exchange. Some of the popular names are Binance, Coinbase, Kraken. But you'll have to find a reliable broker and create an account first. You can trade RNDR right from TradingView charts — just choose a broker and connect to your account.
Crypto markets are famous for their volatility, so one should study all the available stats before adding crypto assets to their portfolio. Very often it's technical analysis that comes in handy. We prepared technical ratings for RNDR (RNDR): today its technical analysis shows the sell signal, and according to the 1 week rating RNDR shows the strong sell signal. And you'd better dig deeper and study 1 month rating too — it's sell. Find inspiration in RNDR trading ideas and keep track of what's moving crypto markets with our crypto news feed.
RNDR (RNDR) is just as reliable as any other crypto asset — this corner of the world market is highly volatile. Today, for instance, RNDR is estimated as 5.50% volatile. The only thing it means is that you must prepare and examine all available information before making a decision. And if you're not sure about RNDR, you can find more inspiration in our curated watchlists.
You can discuss RNDR (RNDR) with other users in our public chats, Minds or in the comments to Ideas.