✴️ Render Token Ultra Bullish, No Doubt (230% Potential)The bear market bottom for Render Token was hit mid-June of the year 2022, more than a year and a half ago... The rest is pure is growth, absolute bullishness.
The chart here, RNDRUSD, is dominated by bullish signals and we have a constellation of factors pointing toward higher prices.
Let's just name a few for entertainment, quickly:
1) Bullish MACD, strong RSI.
2) Falling wedge (bullish pattern).
3) Cup pattern with higher low.
4) Bullish candlestick patterns, closing above moving averages.
5) Strong Bitcoin.
6) Bullish astrological developments.
Just to name a few... The volume should also be good even though it cannot be seen on this chart.
The target on the chart is for illustration purposes only.
I am trying to predict direction only here not timing nor exact resistance levels.
In simple terms, the bigger picture is up, the market will take care of the rest.
Namaste.
RNDRUSD trade ideas

RNDR perfect consolidation?Been looking at this for a while. Right now it is playing out. Breakout this week or invalid.

Render USD Daily Toppy Render and alot of alts looking toppy here but with serious upside potential should Legacy Hold.
Look to Spy for Signal.
Long Term Bullish
Scalpers Short.

RENDER on 15 min Scalping Zones RENDER on 15 min Scalping Zones
BBWP - STOCH - RSI
Volume Profiles
Channel Pattern
Scalping Areas

$RNDR Going Down My sole focus is to reenter the market at the 1.50s level when I receive the right signal to initiate the trade during its downward movement.
Could the price potentially surge higher? Affirmative.
Does this potential rise in price concern me? Negative.
Am I clear on my desired entry point and the reasons behind it? Absolutely.

RNDRUSD: Small but steady rise. Expect more aggression soon.Render Token has been steadily rising since the August 28th contact on the HL trendline but more importantly the 1W MA50, which held for the second time since the week of March 6th 2023. The 1W technical outlook is neutral (RSI = 53.781, MACD = 0.060, ADX = 33.069) meaning that there is significant upside potential. The Bullish Cross that is about to be formed on the 1W MACD also reveals that this is only the start of a long term leg. We are aiming at the R2 level (TP = 4.25000).
## If you like our free content follow our profile to get more daily ideas. ##
## Comments and likes are greatly appreciated. ##

RNDR After the HS target (around $ 1,03) the downtrend could still continue filling the Shark pattern at around 0,475

Breaking outA close above the falling wedge has a 1.64 price target. This would also be a close above the 50ma, and a breakout of the downtrend. Little bit of a bullish divergence playing out on RSI too

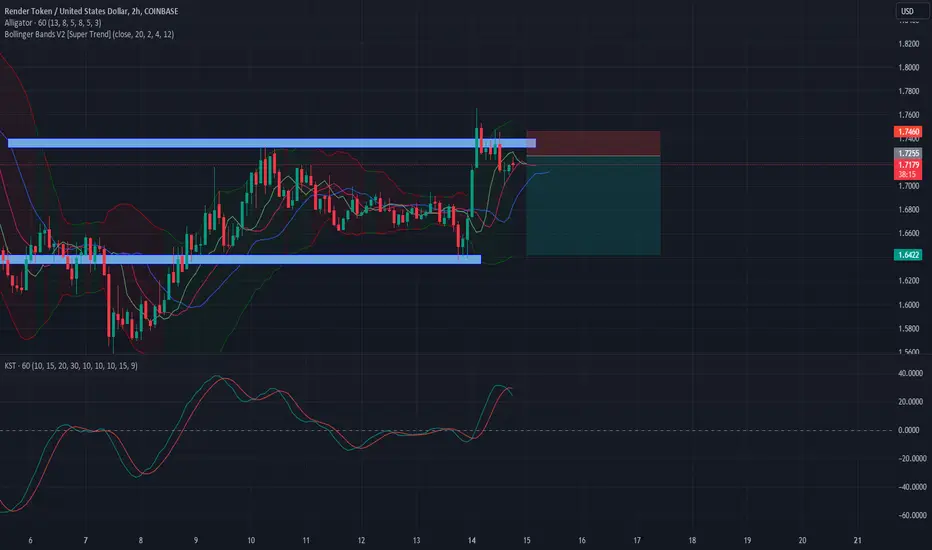
RNDRUSD Strong buy evidence but best wait for a break-out.Render Token (RNDRUSD) is on the 3rd straight green 1D candle, having the best bullish sequence since June 21. The pattern remains a 3-month Channel Down but for the first time this is being executed from oversold 1D RSI levels as well as almost testing the 1W MA50 (red trend-line) for the first time since January 23.
The formation of a 1D Death Cross though, makes our sentiment mixed and prefer to take a confirmed buy signal instead. That will be above Resistance 1 (1.7685) and obviously the top (Lower Highs trend-line) of the Channel Down. Upon that break-out (1D candle closing above) we will buy and target 2.1600 (0.618 Fibonacci).
-------------------------------------------------------------------------------
** Please LIKE 👍, FOLLOW ✅, SHARE 🙌 and COMMENT ✍ if you enjoy this idea! Also share your ideas and charts in the comments section below! **
-------------------------------------------------------------------------------
💸💸💸💸💸💸
👇 👇 👇 👇 👇 👇

Tracking RenderI know that predicting an Alt coins movement doesn’t always pan out, but here it goes anyway.
Renders movement from 2 to 3 rose above the 2.618 and its retracement back to 4 is almost textbook. I believe the 5 will come in above 4.618 or $4.59.
The Mayfair POC and Footprints indicators (along with Stochastic indicator) help me with my assumption.

RNDRUSDNot an investment recommendation. This chart was made for personal study and personal use only. If you liked the idea, please like it. If not, write why. In my humble opinion, the price will go down.
3 red + hammer candle greenthis is bullish. 2$ RNDR immenent.
Still longterm 15$ - 20$ target in play


RNDR fractalRNDR about to go to $4 in the mid term.
Looking for ultimate 15$ target DCA out with a potential 25$ BOT

RNDR Deviation continue ranging or DCBInvalidation - Cross above 2.2 (A Deviation)
Confirmation - Rejected 2.1 and its not a deviation
Target 1: 1.62
Target 2 : 0.9
We have been ranging for 91 Days, price didnt make a new high , but instead ranging.
if thats is not Sign of Weakness, idk what is it.
Anyway during this period of time, this is my plan
1. Small short position to avoid bearish bias during accumulation season
2. Focus on researching next bull market narrative and accumulating altcoin for standby next bull market
3. Spot buying BTC & Eth in multiple level as we cant to identify perfect bottom
4. Macronomics research and reading.
Check my macro writtings about BTC

Render UpdateRender held up well. So could be facing larger falls in a weak market.
Fed Powell Speech tomorrow is key following cool CPI data.

Render, no trade areaRender
Its overpriced ,maybe 10X, it has plenty of competitors, but its done 500% in 5 mths.
Obviously the leader of the Gender Blender pack.
Get Some. cheaper is my Financial Advice.

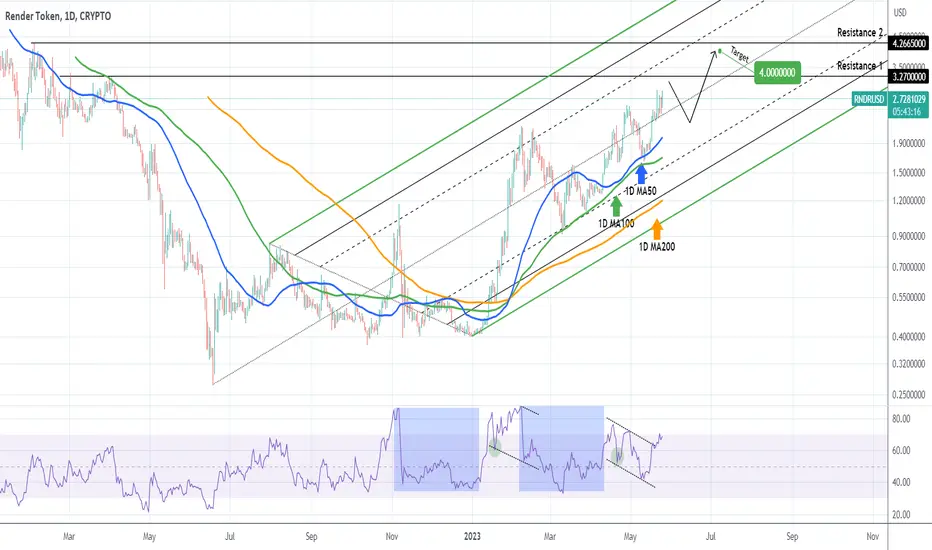
RNDRUSD hitting our target but isn't stopping there!The Render Token (RNDRUSD) is about to hit our long-term target (3.000) of the trade we made on March 22 (see chart below) two months ago, following our pattern perfectly:
The Pitchfork Support and Resistance levels show that it won't be stopping here long-term as the Channel Up that is following since the March 10 rebound on the 1D MA100 (green trend-line) is more than obvious. With the 1D MA50 (blue trend-line) as the short-term Support, we will be buying the next pull-back and target 4.0000, which is right below Resistance 2 (High of February 02 2022).
-------------------------------------------------------------------------------
** Please LIKE 👍, FOLLOW ✅, SHARE 🙌 and COMMENT ✍ if you enjoy this idea! Also share your ideas and charts in the comments section below! **
-------------------------------------------------------------------------------
💸💸💸💸💸💸
👇 👇 👇 👇 👇 👇
Render RNDRRender continues to outperform perform. Probably because it actually does something and has a huge income stream.
If you don't know what it does. Then learn now.


Cup And Handle?Since looking into the people behind Render, I was in. JJ Abrams and Ari Emannuel are heavy weights in various industries and having their name involved in any regular thing wouldnt be smart for them. Cup and handle with a potential to get massive gains if confirmed. LETS GET IT

RNDRUSD fresh breakout RNDRUSD buy at 2.3 target 3.3.
short term target .
a fresh breakout on hourly chart

RNDR ATH... will see $4 soon enoughOnce RNDR completes above 2.20 that will expose the HKEX:4 target and new ATH.
This token has great potential, add it to your watch list.
Good Luck
