RNDR, Render 2.6?What is RNDR?
RenderToken (RNDR) is a distributed GPU rendering network built on top of the Ethereum blockchain, aiming to connect artists and studios in need of GPU compute power with mining partners willing to rent their GPU capabilities out. Conceived in 2009 by OTOY, inc. CEO Jules Urbach and launched in 2017, RNDR held its first public token sale in October of that same year, followed by a private sale period lasting from January 2018 – May 2018, wherein a total of 117,843,239 RNDR were sold at a price of 1 RNDR = $0.25 USD equivalent of token. During the private sale period, early adopters were onboarded onto the RNDR Beta Testnet, where beta node operators and artists worked collaboratively with the RNDR team in building and testing the network, up until its public launch on April 27th 2020.
How does RNDR work
RNDR is an ERC-20 utility token used by artists on the network to exchange for GPU compute power from GPU providers (node operators). RNDR utilizes a combination manual and automatic proof of work system, or in this case proof of render, in order to verify all art has been successfully rendered prior to payment disbursal and art release. Utilizing the inherent security properties of the Ethereum blockchain, proprietary assets are hashed upon upload and sent to nodes piecemeal for rendering. All RNDR payments are stored in escrow during rendering, and are released to node operators upon manual verification by the commissioning artist of successful work. To prevent malicious actors in both user bases, all assets rendered on the network are watermarked until payment is successfully disbursed, upon which time un-watermarked renderings may be downloaded, and all payment is held in escrow until manually verified as being correctly rendered.
About RNDR
Backed by parent company OTOY, the RNDR team is based out of Los Angeles, with team members throughout the world. The RNDR advisory board boasts industry leaders such as Ari Emanuel (Co-Founder and Co-CEO, WME), JJ Abrams (Chairman and CEO, Bad Robot Productions) and Brendan Eich (Founder and CEO, Brave Software and BAT), who have all advised RNDR in various capacities in bridging the gap between creating a system that appeals to both cryptocurrency communities and Hollywood studio production pipelines.
RNDRUSDT trade ideas

RNDR TREND BREAKDOWNPlease see notes on the chart. Looks like a HTF breakdown which usually sees at least a 50% retracement if not FULL.
A close below the 99sma (orange line) would fully confirm trend change.

RNDRUSDT likely to head up to 2.06This long is favorable here. It seems the price has been consolidating in the current range for long and it shall be ready to move upward. The target for the long trade should be the 4h resistance zone 4HR1 which is sitting around 2.06 area.


RNDRHow to tie a PATERNOSTER RIG | DROPPER LOOP easily and correctly
I HOLD ZERO OF THESE COINS AS OF TODAY. NO BAGS NO BUYING. JUST LIKE THE MATH SIDE. NOT $ADVISE.

RNDRUSDTRNDR breaks daily trend line downward....we should wait for retest which is possible at 2.17 and SL ,TP shown in the chart....

Continuation pattern on RNDRLooking at a bearish pennant, target at circle.
Will the blood continue?

rndr higher timeframesrender went perfectly to the buy zone and bounced this is a project that is one for the future for sure many have been accumulating since .80cent or so cant say i have but..... may have been a mistake

RNDRUSDT coming close to weekly supportI did expect it to come to weekly support but not so quick. It is still not there but is almost there in a day. I will buy some spot as planned. I think probability of this giving a good bounce from weekly is very high. If it continues to be so catastrophic then the next level to watch for is monthly support 1.36-1.46. But as I said, I think weekly support shall hold this falling red bar.

RNDRUSD short positionOn the chart we can see a rising wedge formation. Our strategy is enter a short position when the price retest the resistance line.
We can see an on-going distribution as there is a lower highs construction.
Stop loss: 2.957 USD
Target: 2.021 USD
Entry: 2.785 USD

RNDR/USDT IS GETTING READYIm going to buy RNDR/USDT from current price with target 2.95$ .
Good Fibo point reaction + strong daily trend and time reaction.

Render Token Price Prediction 2023Render Token (RNDR) Price Prediction 2023
Render Token (RNDR) ranks 55th on CoinMarketCap in terms of its market capitalization. The overview of the Render Token price prediction for 2023 is explained below with a daily time frame.
In the above chart, Render Token (RNDR) laid out a horizontal channel pattern, horizontal channel pattern also known as the sideways trend. In general, the horizontal channel is formed during the price consolidation. In this pattern, the upper trendline, the line which connects the highs, and the lower trendline, line which connects the lows, run horizontally parallel and the price action is contained within it.
A horizontal channel is often regarded as one of the suitable patterns for timing the market as the buying and selling points are in consolidation.
At the time of analysis, the price of Render Token (RNDR) was recorded at $2.38. If the pattern trend continues, the price of RNDR might reach the resistance levels of $2.117, $2.581 and $3.525. If the trend reverses, then the price of RNDR may fall to the support of $1.638.

RNDR price action analysis. Me again with another setup of RNDR/USDT. I have mentioned my analysis by showing that RNDR is slowing making an upward trend channel. I have used 12HTF and mentioned my bullish and bearish points in it. As the market is right now going down, some of the alts are performing in the upper direction, and RNDR is one of them because, from this new year on, RNDR is performing very well and has also touched ATH. Despite dropping on May 8, we can see the upward trend is still on the move. Let's see what happens in the upcoming market. Monday's opening is very important.
RNDR is following bitcoin price movements and consolidating on others. Things can get choppy too. be careful!
No matter where the market goes, I have mentioned my quick scalping idea for both bullish and bearish scenarios.
Please respond with your constructive criticism. #PEACE
#DYOR #Market #Neutralview #RNDR #CRYPTO

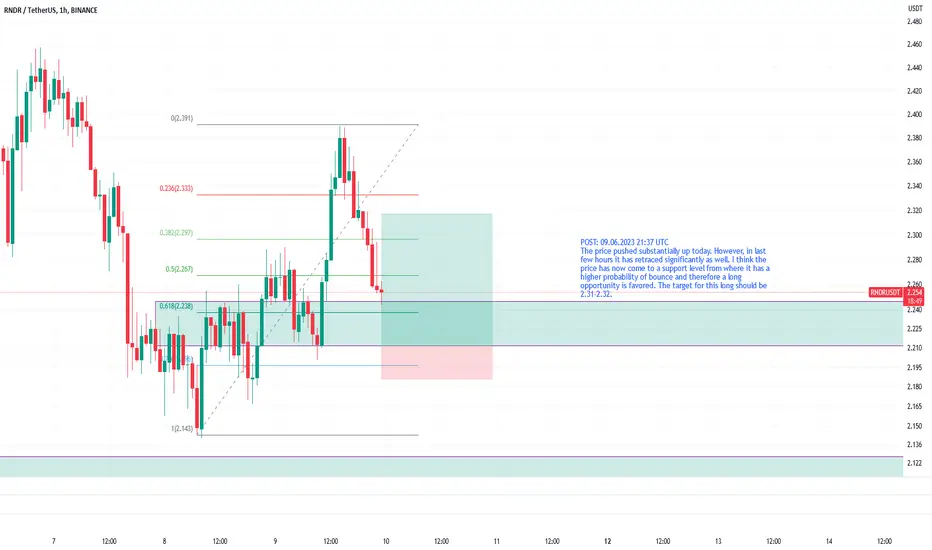
RNDRUSDT at support, likely to head up to 2.31-2.32The price pushed substantially up today. However, in last few hours it has retraced significantly as well. I think the price has now come to a support level from where it has a higher probability of bounce and therefore a long opportunity is favored. The target for this long should be 2.31-2.32.
RNDR Decision time!RNDR approaching longer term trend line again.
Possibilities of going bearish if we loose this trend-line.
If we bounce it is going to be super bullish and there are in-balances to target above. I will update after the break. I

RNDR OVERALL STILL BULLISHHello Traders and everyone, I am Hadi Karaali, Known as SNIPERS_FX
If you like the idea, do not forget to support with a like and follow.
RNDR STILL OVERALL BULLISH!
As we can see price is still overall bullish trading inside this channel making clean new highs and higher lows.
Meanwhile, bears took over after breaking below the marked swing low, then bears are in control for now, speculating new bearish movements.
And as the price will be approaching our lower rising trendline, we will be looking for new bullish reversal pattern.
Unless price managed to trade higher, and as the price will be approaching our upper resistance zone,
Then we will be looking for new bearish reversal pattern.
If you like this kind of analysis don't forget to like and follow
and as usual follow your trading plan and manage your risk.
Be patient and good luck!

RNDRUSDT likely to head down for daily support for a bounceThis one seems to be heading for the daily support DS1. I would prefer a long from that zone. Therefore, I will remain patient for a trade with this one. If it does not visit the DS1 zone and moves beyond 2.45, that would also signal to take long trade from other levels. So lets just be patient for a while. I believe the trade opportunity will come to us. The planned trade setup is shown but may differ from the actual trade setup. I will post the actual trade setup when I take it.

RNDRUSDT weekly support an preferable spot buy zoneI am not holding any spot RNDR tokens. I did not know about this one early enough. But I am planning to get some spot buy of this token when the price hits weekly support. Seems a bit far fetched by looking at the chart but its possible that it may revisit that weekly support zone. But I might grab some spot on the daily support zone as well to sell later. Seems like not a bad spot for getting some.

Long on RNDR 15 minute!We are approaching a decent support level.
Fibonacci retracement gold zone reached.
Reaching a high volume node on the visible range volume profile.
Stochastic RSI is also at the overbought level and has been since 6am.
I would like to see a bounce up to the previous support which will take us back up close to the 200 EMA.
Short time frame only.

RNDRUSDT at daily support, likely to head to 2.40This one did come back where we were expecting it to. Now from here it may bounce. We can take a long from here for a few percent gain. The target should be 2.40 as that is the low time frame resistance for the time being.

Short signal on RNDROpen short ONLY IF price is stabilized under 2.26; Entry: 2.25 SL: 2.40 TP: 2.06, 1.81

RndrusdtAccording to the balance levels and the balance, the overlapping area and the next target are 2.02 and 1.66.

Artfully accumulate $RNDR between the depths of 2.5 to 2.35As the symphony of cloud rendering echoes across the digital landscape, the thunderous beats of opportunity resound in my ears, igniting an indomitable bullish fire within. Seizing this auspicious moment, I artfully accumulate CRYPTOCAP:RNDR between the depths of 2.5 to 2.35, acutely aware of its profound value and the potential it holds to reshape the rendering ecosystem. With a lofty target price (TP) of 2.88 dancing before my eyes like a celestial dream, I stand poised to embrace the meteoric rise that awaits, fortified by the unwavering conviction in CRYPTOCAP:RNDR 's ability to ascend to glorious heights.
