RNDR (Y24.P1.E1).MACRO targetsHi Traders,
Lets see at the end of this bull run, how accurate was this forecast.
I would not put much weight on what I'm doing here as its for my interest only to see later on what worked and what didn't in terms of using fibonacci and some assumptions.
The minimum I expect is BASE 3 for a parabolic chart, and Base 4 stage would be mega bullish.
****
IF HOWEVER we get it perfect, not to say I will, then it makes a great case to short the level I said it might reach.
Other charts of a similar nature can be found, like FTM
All the best,
S.SAri
RNDRUSDT trade ideas

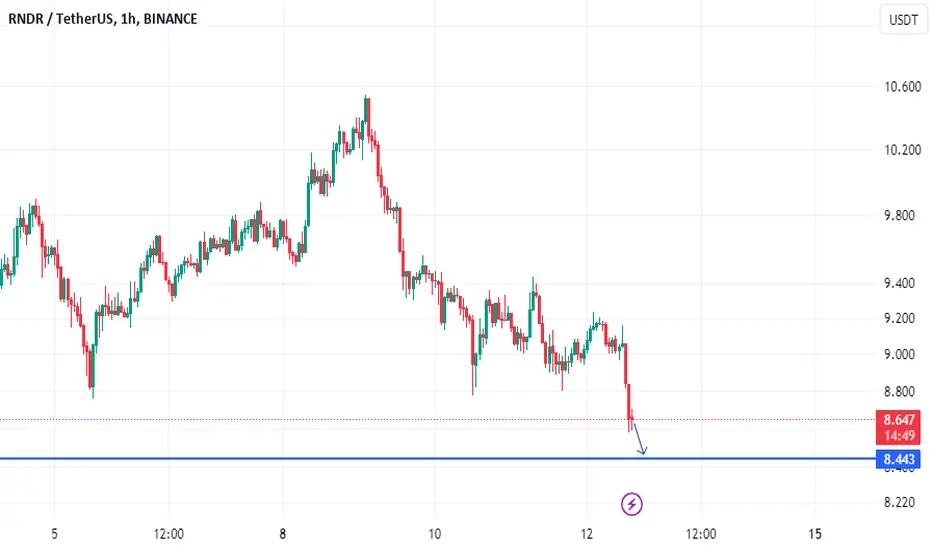
RNDR 12/04/2024Patience is the key, RNDR has entered the levels that we anticipated. Now we need to start buying. There is one important thing, 7.945 was our all time high. If go lower from this level it might trigger the deviation since this chart is a bigrange

RNDR LONG SETUPCRYPTOCAP:RNDR play when we take back SSL as support...
Patience...
#trading
@rendernetwork

rndrSupport and press the rocket to cheer me up
Observe the ten percent loss limit
Stay away from Bitcoins
Feel free to buy and sell and post your comments
Render Double BottomRender Double Bottom. Bouncing off resistance. Price target previous ATH 53% up.
Could take a few weeks to play out.

#RNDRUSDT Monthly Chart Projection The RNDRUSDT pair is currently in a consolidation phase, with the price trading around $2.20 USDT.
According to the MACD indicator, which shows a bearish crossover signal, there is potential for the pair to continue its downward trend in the short term.
The RSI indicator is currently neutral, suggesting that the pair is not overbought or oversold at the moment.
The 20-day and 50-day EMAs are currently below the current price, indicating a short-term bearish trend. However, the 200-day EMA is above the current price, indicating a long-term bullish trend.
If the RNDRUSDT pair breaks and stays below the support level around $1.40 USDT, it could potentially enter into a stronger bearish trend. In this scenario, the pair could reach the next support level around $1.00 USDT.
Alternatively, if the RNDRUSDT pair breaks and stays above the resistance level around $3.00 USDT, it could potentially enter into a bullish trend again. In this scenario, the pair could reach the next resistance level around $4.00 USDT.
It's important to consider other market factors, such as economic news and ongoing global events, to assess potential price movements for the RNDRUSDT pair on a monthly chart.

Buy now at the beggining of the breakout, or ......wait to see if the market retests support on the line, after the CPI and PPI data is released this week.
The best approach depends on your investment goals, risk tolerance, and market outlook.
I would not recommend using a leverage higher than 3 for this trading pair.

RNDRUSDT - Continuation IdeaAn idea suggesting a pullback to a strong horizontal level then price proceeding onward with the bull movement
The bars pattern plotted is how I think price action will play out.
AI coin

RNDR finding footingRNDR is finding footing on a new weekly fib extension I have drawn. The momentum trend is around 8.6$ as well. A bottomed stochastic, uncertain markets lead to high volatility. Remember, many people yelled at me when I took a sliver of profits with RNDR and INJ pumping obnoxiously, and here we are in bloody times. I will admit even I am not enjoying this dip and I love dippertunities. Medium term I think RNDR visits 14$.
-My next sell target is 20$ for 25% of my position, the funds are already on Coinbase.
-My long term target remains 40$ based on network expansion I will sell all but my remaining 25%.
-Dont marry your bags, moon bags are fine but we are here to try to outperform BTC

RNDR - accumulationRNDR/USDT: upward pennant, which indicates a continuation of an upward trend after a consolidation phase. Key levels to watch are $8.68 (support) and $13.81/$17.60 (resistance). Volume is decreasing, which is common in this pattern. The RSI is neutral at 57.54. Traders might wait for a breakout above the pennant with increased volume to consider a long position, using a stop-loss below the pennant's lower trendline for risk management. Remember to consider other factors like market sentiment and news.


Quick Bitcoin UpdateHello Traders,
This is a quick update on Bitcoin and also on RNDR. Yesterday we told you clearly about resistance and support and Bitcoin have tested exactly same levels on both sides

Render (RNDR) is setting up for upto 12.50% pumpHi dear friends, hope you are well and welcome to the new trade setup of Render Token (RNDR) with US Dollar pair.
Previously we caught almost 70% pump of RNDR as below:
Now on a 4-hr time frame, RNDR is about to complete another bullish AB=CD move for the next pump.
Note: Above idea is for educational purpose only. It is advised to diversify and strictly follow the stop loss, and don't get stuck with trade.

RNDR buy range RNDR buy ranges
10.70
10.029
* DISCLAIMER, PLEASE ALWAYS DO YOUR OWN RESEARCH *
The information contained herein is for informational purposes only. I do not guarantee any particular outcome. Past performance does not indicate future results.


RNDUSD is in bullish as it printed bullish Engulfing candle closRNDUSD is in bullish as it printed bullish Engulfing candle closed in 30 mint time frame

RNDR consolidationRNDR looks to be attempting to break the 17 day consolidation. I expect a retest of near 14$ very soon. BTC has defied my short thesis so far and we have less than a month now before the halving. Maybe BTC will be less volatile going forward.
-Profit taking 25% of my bag at 20$ as I am up VERY much
-Long-term target is 40-42$ based on network expansion

FET IS ABOUT TO PUMP 50% FROM CURRENT PRICE.FET is currently trading in rectangular trendline and is ready to pump from here. Long setup would be better choice.

RNDRUSDT.PHello Trader BINANCE:RNDRUSDT.P
valid double bottom area and has not retested for now, can wait for the re-test area in the 11.0512 area or a little higher, because there is a small base support in the area, just limit buy.
Please add a comment and Positive feedback and constructive criticism are important to authors and the community.
Disclamer: Not Financial Advice

RNDR 23/03/2024 Render reached our second target level (12.717). I updated the chart. Potential support levels are daily imbalance and weekly imbalance below. Weekly imb and old high are on the same level which is important. If we see any pullback at those levels it will give an opportunity for us. I'm setting my alarms and will keep an eye on.
