ROSEUSDT on the Verge of a Breakout or Breakdown?Yello, Paradisers! Are you watching ROSEUSDT closely? If not, you might want to pay attention because this setup is reaching a critical point that could make or break its next move. Let's dive into the key levels and scenarios we're monitoring to stay one step ahead of the crowd.
💎ROSEUSDT is attempting to form a W pattern from a key support zone. If this pattern fully materializes and we see a breakout with a confirmed candle close above the resistance, the probability of a bullish continuation will increase significantly. This move could open the door to higher price levels.
💎However, it’s essential to wait for confirmation—the breakout must be backed by a solid close above the resistance level to validate the W pattern. No premature entries, Paradisers! Discipline is key.
💎If the price pulls back before breaking out, there’s a high chance of a bounce from the strong support zone. But to increase the odds in our favor, we need to see signs of bullish intent, such as a bullish I-ChoCH (Internal Change of Character) or familiar bullish reversal patterns like the W pattern or inverse head and shoulders on lower timeframes.
💎Keep in mind—it's not just about the support holding, but also about how the price reacts at these levels. Strong bullish reactions give us more confidence to enter trades.
💎On the flip side, if ROSEUSDT breaks down and closes a candle below the key support zone, it will invalidate our bullish idea entirely. In that case, it’s better to remain patient and wait for new, more favorable price action to form before taking any positions.
💎Patience and discipline are what separate successful traders from the rest. We wait for high-probability setups with clear confirmations. No rushing into trades without a validated breakout!
Trade smart, Paradisers. Stick to your strategy, and remember—the market rewards the most disciplined players.
MyCryptoParadise
iFeel the success🌴
ROSEUSDT.P trade ideas

ROSE/USDT Price Breakout: Bullish Continuation in PlayROSE/USDT pair has successfully broken above a key descending trendline, signaling a potential bullish reversal.
The price has reclaimed the $0.08-$0.09 support zone, which is now acting as a strong base for further upward movement.
DYOR, NFA

Is ROSE Set for a Bullish Explosion?ROSE has been trading in a clear descending channel, a pattern often seen before major market moves. Currently, the price is testing the resistance of this channel, and a breakout here could be the catalyst bulls have been waiting for.
If the ROSE breaks above this descending resistance, the first major challenge will be the green resistance zone at $0.11564 - $0.11857. A decisive breakout above this level could pave the way for a strong bullish rally. The next key target is the purple resistance zone at $0.16714 - $0.17485.
However, it’s crucial to wait for confirmation with strong volume and clear bullish candles to avoid being caught in a fake breakout. All critical levels are clearly marked on the chart.

#ROSE Ready for a Bullish Breakout or Not? Key Levels to WatchYello, Paradisers! Is #ROSEUSDT preparing for a bullish breakout, or will we witness a deeper correction? Let’s dive into this crucial setup for #Oasis:
💎#ROSE has been trading within a well-defined descending channel on the 8-hour chart, a structure that often precedes significant market moves. Price is currently hovering near the resistance of this descending channel, and a breakout here could be the game changer bulls have been waiting for.
💎If #ROSEUSD breaks above the descending resistance, the first major hurdle will be the resistance at $0.1159. A clean and sustained breakout above this level could signal the start of a strong bullish rally. The next target would then lie within the major resistance zone between $0.1597 and $0.1671, representing a potential upside. However, you must watch for confirmation with strong volume and clear bullish candles to avoid falling for a fake breakout.
💎On the downside, the $0.074 level serves as critical support and has been a stronghold for buyers so far. If LSE:ROSE fails to break the resistance and bears regain control, we could see the price revisit this support zone. If this level also fails, the last line of protection for bulls is the underlying strong support at $0.056.
💎A daily close below $0.0563 would invalidate the bullish setup and open the door to further downside toward the $0.0400 region, where stronger demand could be tested. However, discipline and risk management remain essential as we await confirmation of the next move.
Stay focused, patient, and disciplined, Paradisers🥂
MyCryptoParadise
iFeel the success🌴

ROSEUSDT: Catching the Retracement for a Potential Big Move!!ROSEUSDT has shown promising signs of a potential bullish continuation. After a successful bounce from a major support level, the price consolidated briefly before a strong breakout yesterday, pushing through resistance. Today's retracement to the broken resistance level (now acting as support) presents a potential entry opportunity for traders. Always manage your risk and use appropriate position sizing.
BINANCE:ROSEUSDT Currently trading at $0.092
Buy level: Above $0.09
Stop loss: Below $0.076
Target : $0.18
Max Leverage 3x
Always keep Stop loss
Follow Our Tradingview Account for More Technical Analysis Updates, | Like, Share and Comment Your thoughts

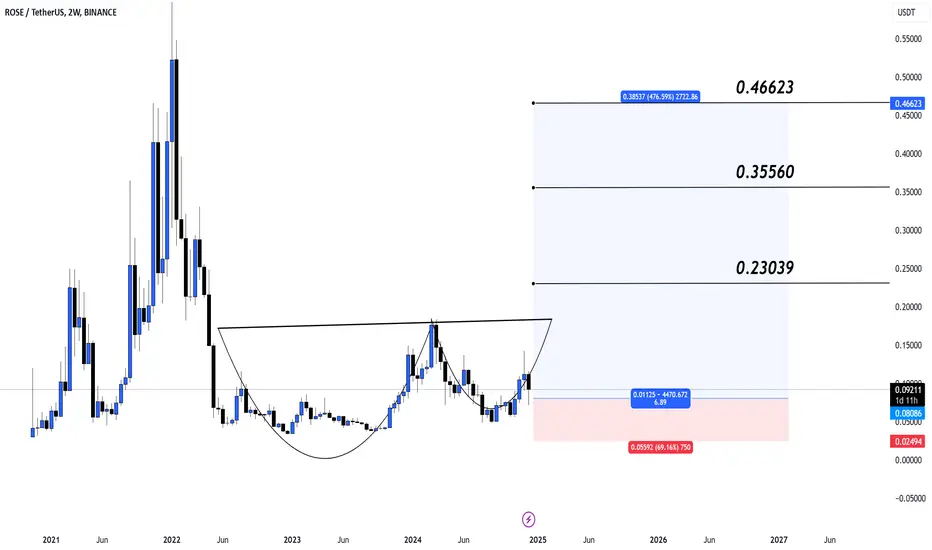
ROSE Forms Bullish Cup and Handle, Eyes Key TargetsLSE:ROSE is consolidating at the handle of the cup and handle formation, a bullish reversal pattern. The breakout above the cup resistance zone could initiate a strong upward move, targeting $0.23039 (T1) initially, followed by $0.35560 (T2) and $0.46623 (T3).
Entry Zone: Near $0.08086 during pullbacks.
Stop Loss: Below $0.05592 to minimize risks.
Take Profit: Gradually at $0.23039, $0.35560, and $0.46623.
ROSEUSDT 1WROSE ~ 1W
#ROSE Again rejected from this resistance line. If you still have Conviction on this coin,. This support block would be a very good buying place for now.

ROSE Long Spot Trade OpportunityMarket Context:
ROSE is showing renewed strength after rallying into its first resistance at $0.15. The price is now retracing towards the golden zone, with strong confluence at the 200-day EMA near the $0.085 support level. This setup presents a favorable risk-to-reward opportunity for an upward continuation.
Trade Details:
Entry Zone: $0.085 – $0.10
Take Profit Targets:
$0.18
$0.28
$0.42
Stop Loss: Daily close below $0.07
This trade combines a strong support zone with clear upside targets, providing a well-balanced setup for capturing further momentum. 📈

ROSE/USDT Price Prediction - 1WTrend Prediction - ROSE/USDT Forecasting
Resistance and Support Lines
**** Yousef Sharafi ****
Follow me here for more analysis

Alikze »» ROSE | Bullish Wave 3 or C Scenario - 1D🔍 Technical analysis: Bullish Wave 3 or C Scenario
📣 BINANCE:ROSEUSDT In the daily timeframe, according to the analysis presented earlier, the Rose currency encountered demand after correcting to the 0.23 Fibo area, which continued to grow in accordance with the movement path to the supply area.
🟢 In the daily updates, it was also mentioned that a bullish flag was formed, which had a growth of 74% as much as the flag bar.
🟢 Currently, in the daily timeframe, it has also had a movement cycle to the supply area of 13 cents, considering the current momentum.
💎Therefore, considering the momentum, it can continue to the red box area (supply area) with a pullback to the green box area.
⚠️In addition, if the price enters the LVL Invalidation area, the bullish scenario will be invalidated.⚠️
»»»«««»»»«««»»»«««
Please support this idea 💡 with a LIKE 👍 and COMMENT 💬 if you find it useful and Click "Follow" on our profile if you'd like these trade ideas delivered straight to your email 📧 in the future.
Thanks for your continued support.🙏
Best Regards,❤️
Alikze.
»»»«««»»»«««»»»«««

ROSE, by any other count...If you find this information inspiring/helpful, please consider a boost and follow! Any questions or comments, please leave a comment!
In at 0.082.
Idealized Count.
Want to break above and flip the
0.137 level it has had some trouble with in the past.
0.10467 break complicates the Elliott.
Trade safe, trade smart, trade clarity.

#ROSEUSDT: Breakout Imminent or Bullish Momentum Fading?Yello, Paradisers! Are we on the brink of a massive breakout on #ROSEUSDT, or will the bulls lose their steam? Let’s break down the analysis and find out.
💎#ROSEUSDT is showing encouraging signs of a bullish continuation from the key support level at $0.06727. If the price manages to stay steady at this level, we could be looking at a breakout above the descending resistance of the ongoing channel. Momentum is the driving force here if it sustains, a significant price move could be just around the corner.
💎However, we aren’t in full breakout mode just yet. For a confirmed move, we need a decisive break above the internal resistance at $0.08367, supported by strong engulfing candles and consistent momentum. Until that happens, it’s wise to stay cautious and avoid entering positions too soon.
💎But what if the bulls lose their momentum? If #ROSEUSDT fails to break above $0.08367 and starts to show signs of weakening, sellers may step in. The critical support to watch is $0.04892, a level that has proven resilient in the past. A bounce from here would keep the bullish outlook alive, but a break below $0.04892 would invalidate the bullish setup and could lead to a sharp decline.
💎The next move will be pivotal, Paradisers. Whether we see a breakout or face a reversal, sticking to a strategic approach and disciplined risk management will keep us ahead of the game. Patience and a well-executed plan will separate the winners from the rest.
Trade smart, Paradisers. Consistency and discipline are key focus on the bigger picture and let the market come to you. Stay sharp, and let's see how this unfolds!
MyCryptoParadise
iFeel the success🌴

$ROSE is preparing to fly!ROSE is a good project, with top investors. Unlocked coins for investors are coming to an end and I expect final distribution soon. From a technical point of view we are above 50 EMA, also we have finished the accumulation phase and now is a great opportunity to ride up to Fibonacci level 2! The zone of interest for selling is around 0.3-0.32$.
Best regards, Horban Brothers.

#ROSE/USDT Ready to go higher#ROSE
The price is moving in a descending channel on the 30-minute frame and sticking to it well
We have a bounce from the lower limit of the descending channel, this support is at 0.1254
We have a downtrend on the RSI indicator that is about to be broken, which supports the rise
We have a trend to stabilize above the moving average 100
Entry price 0.1290
First target 0.1343
Second target 0.1387
Third target 0.14424

#ROSE/USDT Ready to go up#ROSE
The price is moving in a descending channel on the 1-hour frame and sticking to it well
We have a bounce from the lower limit of the descending channel, this support is at 0.07342
We have a downtrend, the RSI indicator is about to break, which supports the rise
We have a trend to stabilize above the moving average 100
Entry price 0.07588
First target 0.07983
Second target 0.08522
Third target 0.090258

ROSE Rose is currently forming a local double bottom and is stuck at the 50 MA, indicating that the bullish trend is still ongoing.
Support: $0.08066
Resistance: $0.1040
Target: $0.1300

Will ROSE Break the 0.85 Support or Continue Its Bullish Move?Hey there, ✌By analyzing the daily chart of BINANCE:ROSEUSDT , we see that the price has had a significant upward movement from the 0.060 level, which led to breaking the supply zone. As shown in the chart, after breaking the supply zone, the price entered a range after reaching 0.090 and has now returned to the breakout level, which has turned from resistance into support.
If the price stabilizes above 0.085, I expect it to move towards the target range of 0.10 (descending orderblock zone) and eventually reach the supply zone between 0.11500 and 0.11800. To understand the next movement, we need to observe how the price reacts at these levels.
💡 Keep in mind, this is just my personal perspective and shouldn't be considered as financial advice. I’d love to hear your thoughts and engage in a discussion!
Happy trading!✌😎
Feel free to reach out if you have any questions or need more clarification. I'm always here to assist!✌
If you want any further adjustments, just let me know!

Alikze »» Rose | Ascending corner pattern🔍 Technical analysis: Ascending corner pattern
- In the daily time frame, in an ascending channel, according to the predicted path, it has grown up to 1.618 fibo of the previous wave, a range of 0.17.
- In the last analysis presented in the 4H time frame in an ascending channel, after breaking the channel and exiting it and breaking the zone, it experienced a correction.
- In the daily time frame, it has had a complete upward cycle, and wave 3 has grown as much as 1.618 of the previous wave.
- At the moment, correction is done as much as 0.23 fibo of the whole structure.
- A corner pattern has been formed which can grow up to the supply area by breaking the 0.072 area.
🛑 The most important resistance: ~ 0.072
💎 NOTE: In addition, if the 0.23 area breaks and stabilizes below it, the bullish scenario will be invalidated.
»»»«««»»»«««»»»«««
Please support this idea with a LIKE and COMMENT if you find it useful and Click "Follow" on our profile if you'd like these trade ideas delivered straight to your email in the future.
Thanks for your continued support.
Best Regards,❤️
Alikze.
»»»«««»»»«««»»»«««
BINANCE:ROSEUSDT


SPOT ROSE LONG 30.11.2024🎯Purpose:
0.11789
‼️We enter at 0.5% of the allocated money for spot trading.

RoseusdtRose looking good here , I would buy spot though if going heavy or if leverage make sure to know how to use it. Great coin for this bull run.

Oasis Network (Rose)If we look at the Rose behavioral patterns, it looks like a sinusoidal wave in which the amplitude is increasing logarithmically. So, doing simple math, when the next sinusoidal wave starts it has to go up about 2000% 😵
What do you think?

ROSE / USDT: gearing up for breakout ROSE/USDT: Gearing Up for a Breakout
ROSE/USDT is shaping up for an exciting move 📈 as it approaches a critical trendline resistance zone 📊. The price has been consolidating tightly, creating the perfect setup for a potential breakout 💥. If the breakout happens, we could see a strong bullish trend unfold 🚀. Keep a close eye 👀 on this pair and wait for confirmation before acting.
Key insights:
1. Trendline resistance: ROSE/USDT is approaching a long-standing trendline that has previously acted as a barrier. A break above this could mark the start of a strong upward move.
2. Volume surge: Watch for a significant increase in trading volume during the breakout to confirm buyer strength 🔥.
3. Bullish signals: Momentum indicators like RSI and MACD are trending positively ⚡, supporting the case for a bullish breakout.
Steps to confirm the breakout:
Look for a clear 4H or daily candle closing above the trendline 📍.
A noticeable spike in volume during the breakout can signal strong buying activity 📊.
A retest of the broken resistance as a new support zone adds credibility to the move ✅.
Be cautious of fake breakouts, such as sharp reversals or wicks above the trendline ⚠️.
Potential targets (post-breakout):
Risk management strategies:
Use stop-loss orders to manage your risk effectively 🔒.
Ensure position sizing aligns with your overall trading strategy 🎯.
This analysis is for educational purposes only and not financial advice. Always conduct your own research (DYOR) 🔍 before making investment decisions.
