Oasis RoseI think this is still the best privacy L2 for the ethereum network...
Applications and variations of mixers like tornado cash also exist though...
In the long term eth thesis a privacy focused l2 makes ALOT of sense for funneling money between black and white markets.. for political reasons or otherwise. Institutions build on eth for its reliability...
Its a 20x to aths from here if that is eventually possible again (20k eth would do it.. )
Alts and ecosystem coins at psychological market lows around here when compared with other markets btc gold spx etc so we might be in the maximum opportunity zone though I expect altseason to be highly targeted and selected as retail interest/funds are pretty minimal vs institutions right now.. coins with a long term genuine thesis that institutions will understand easily.. they're slowly coming over to eth and we are seeing massive institutions start building their own projects so og crypto devs with all their tech scrutiny /battle tested code from previous cycles should start coming into the window of relevance as these institutions start becoming more educated on the broader crypto markets long term thesis.
Og coins like xmr showing strength along with new tech coins like hype will eventually open the minds of institutions to the broader thesis'
Rose could be part of that wave and we are technically seeing a potential deviation double bottom here..DYOR as always.
ROSEUSDT trade ideas

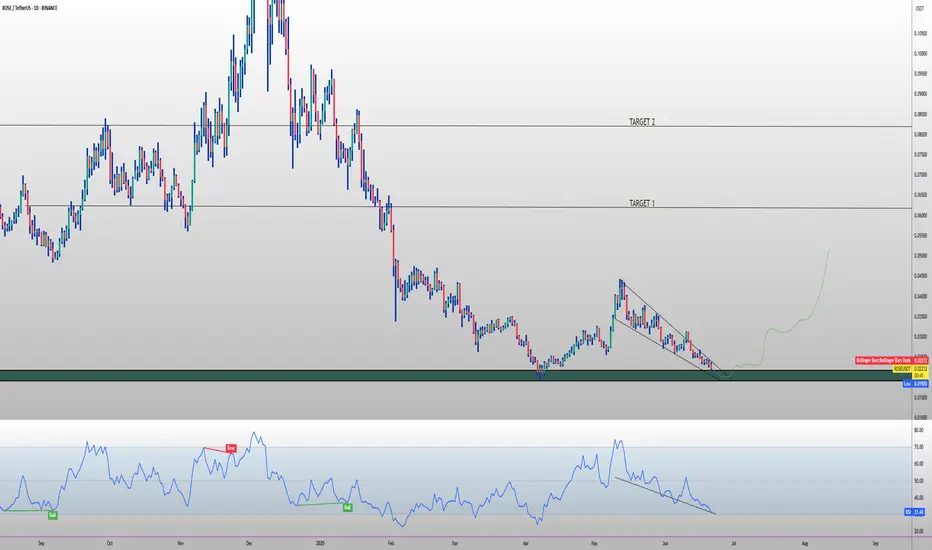
Rose Network: Double-Up Within Weeks (PP: 435%)ROSE grew 130% between April and May, a relatively small wave. The peak happened at 0.04424. The low in April happened at 0.01920. The previous wave high in early December 2024 happened at 0.14260. As you can see, a relatively small wave. But this is good news.
In June we get a higher low compared to 7-April. A technical double-bottom. This double-bottom/higher low reveals a higher high next. This is why this is a good an easy setup. The next target is already confirmed. We can buy easily; no stress, fully relaxed, because we know prices will grow.
We know prices will grow because they grew in April and now we have the same low. The downtrend is no more and thus a new uptrend starts. 139% is the very easy target based on the short-term. Mid-term and long-term there will be so much more growth. 337% & 435%.
Thank you for reading.
I like this one. It is an easy win. Easy pair to double-up.
Namaste.

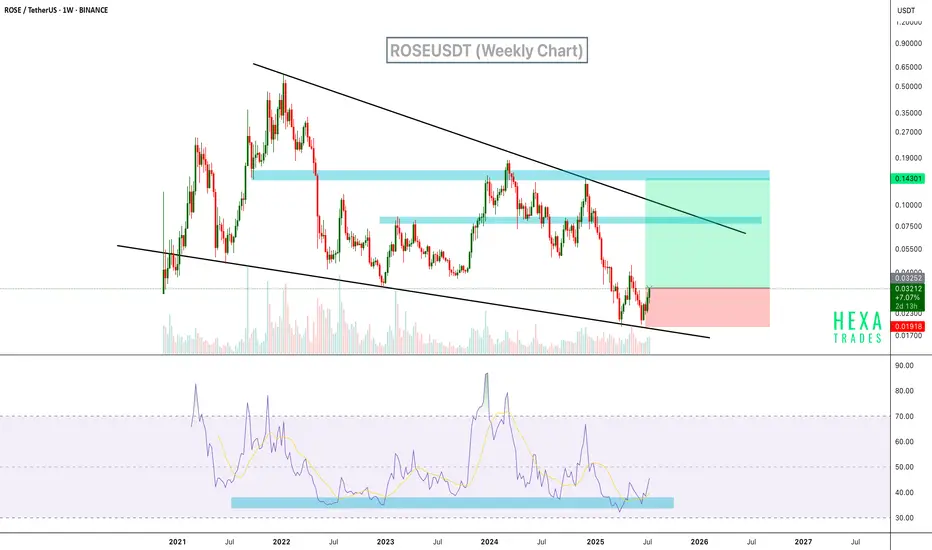
ROSEUSDT Rebounds from Wedge Support BINANCE:ROSEUSDT is currently trading within a long-term descending wedge on the weekly chart, a classic bullish reversal pattern. Price recently bounced off the lower wedge support with strong momentum. Additionally, the RSI indicator has rebounded from a historically strong support zone in the oversold region, which has previously signaled major bottoms.
Resistance 1: $0.048
Resistance 2: $0.075
Resistance 3: $0.145
Cheers
Hexa
ROSEUSDT Forming Descending TriangleROSEUSDT is showing a promising setup for traders keeping an eye on high potential breakouts. The pair has formed a clear descending triangle pattern, which often acts as a reliable continuation or reversal signal depending on where the breakout occurs. With trading volume staying healthy and steady, the conditions are aligning for a potential sharp move to the upside that could deliver an impressive 90% to 100% gain if momentum builds up as expected.
Oasis Network (ROSE) has been drawing investor interest recently thanks to its strong focus on privacy-first and scalable decentralized finance solutions. As the market shifts back towards Layer 1 blockchain projects that deliver real-world use cases, ROSE stands out for its unique mix of confidential smart contracts and data privacy tools. This fundamental strength is likely to keep investor sentiment bullish, providing extra fuel to any technical breakout from the descending triangle pattern.
For technical traders, the key level to watch will be the breakout line at the top of the triangle. A confirmed breakout with increased buying volume could trigger significant upward momentum. It’s important to have a clear risk management plan in place, as descending triangles can sometimes produce fakeouts before the true direction unfolds. Keeping an eye on daily closing candles and volume spikes will be essential for capturing the best possible entry.
✅ Show your support by hitting the like button and
✅ Leaving a comment below! (What is You opinion about this Coin)
Your feedback and engagement keep me inspired to share more insightful market analysis with you!

ROSE/USDT Descending Triangle Breakout – Trend Reversal📊 Pattern Analysis – Descending Triangle at the End of Downtrend
ROSE/USDT has been forming a descending triangle pattern since late December 2024. This pattern features:
🔽 Downward sloping resistance: A descending trendline tested multiple times (5+ touches), showing strong validity.
🔲 Horizontal support zone: Price has held firm between $0.02200 - $0.02400, acting as a key demand area since March 2025.
Although descending triangles are often continuation patterns, in this context — appearing after a long-term downtrend — it increases the probability of a bullish reversal if the breakout confirms.
🚀 Bullish Scenario – Potential for Strong Rebound
If ROSE breaks above the descending trendline:
✅ Breakout Confirmation: Daily candle close above $0.02600 - $0.02800 with strong volume
📈 Bullish Targets (based on previous resistance zones & pattern projection):
$0.03140 – Minor resistance and former structure
$0.03477 – Previous high from May 2025
$0.04222 – February consolidation range
$0.04700 – Key prior distribution zone
$0.06191 – Primary target from triangle breakout (measured move)
$0.08453 and above – Potential extended rally if strong momentum follows
The reward-to-risk ratio is highly favorable on confirmation of a breakout.
🧨 Bearish Scenario – Breakdown Threat Looms
If ROSE fails to break out and instead closes below the horizontal support at $0.02200:
⚠️ This would signal a bearish continuation
📉 Potential drop to:
$0.01920 – The current multi-month low (key support level)
Breakdown of this level would mark a new lower low, confirming ongoing bearish trend
Caution is advised if volume increases during a breakdown.
🔍 Technical Insights:
Price is squeezing at the apex of the triangle — a breakout is imminent
Volume is still relatively low, suggesting accumulation or indecision
A volume spike will likely precede a confirmed breakout move
Market is at a decision point — either a trend reversal or continuation
🧠 Conclusion:
ROSE/USDT is on the edge of a major move. The descending triangle has matured, and a breakout in either direction could trigger a significant price reaction. Traders should monitor this setup closely as the breakout may occur within days.
#ROSEUSDT #CryptoBreakout #DescendingTriangle #TechnicalAnalysis #AltcoinSetup #ChartPattern #CryptoTrading #BullishReversal #BearishScenario #PriceAction #BreakoutAlert

ROSE EASY 3X FROM HERE FOR 2025🔥 LSE:ROSE long setup (1D) 🚀
✅ Entry Zone: $0.0225 – $0.020 (multi-year demand + wedge apex)
🎯 Targets
• TP-1: $0.060 (2024 range mid)
• TP-2: $0.082 (last breakdown block)
⛔ Stop-Loss
Daily close < $0.017
📊 Thesis
• Sapphire – the ONLY confidential EVM – live & onboarding dApps 🛡️
• illumineX, the first MEV-resistant private DEX, launched on Sapphire ⚡
• $200 M Oasis Ecosystem Fund (Binance Labs, a16z) fuels builder grants 💰
• Native “ROFL” privacy layer lets AI & RWA apps run off-chain yet settle on-chain 🤖
• 2.3 B ROSE reserved for stakers; ~28 % of supply already locked 🔒
• Roadmap 2025 = easier TDX containers + OasisAI privacy compute stack
• Meta & other AI giants piloting confidential data sharing on Oasis 🌐
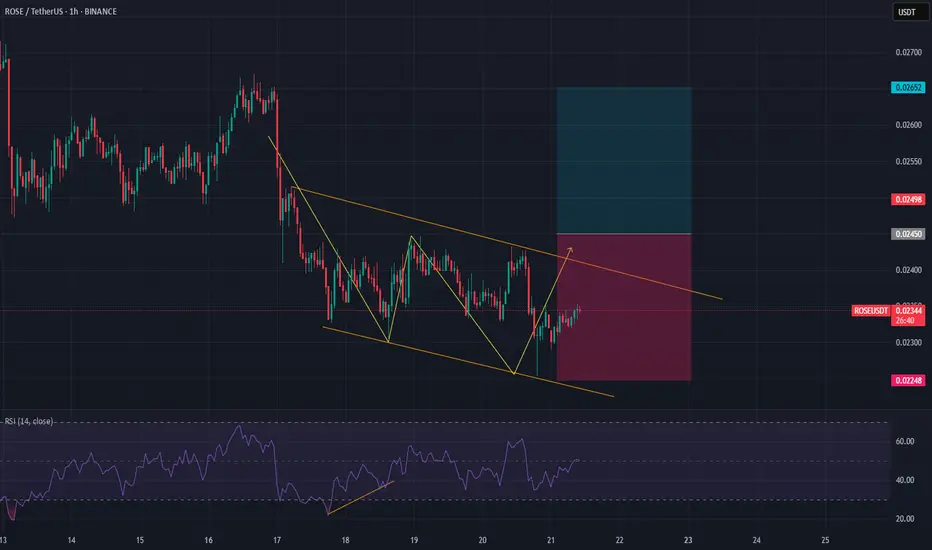
roze/usdt Trade setup 🚨 ROSE/USDT Trade Setup (4H Chart)
Entry: $0.0335
SL: $0.0290
TP: $0.0450
Falling wedge breakout in play—bullish momentum expected! 📈
Risk/reward looking solid. DYOR!
#ROSE #CryptoSignal #Altcoins #CryptoTrading #ROSEUSDT #ChartAnalysis #TradingView #Bullish #Breakout
$ROSEUSDT Update 🚨 LSE:ROSE Update – 271% Upside Potential? 👀
ROSEUSDT broke out of a long-term downtrend and flipped the key resistance zone into solid support.
Volume rising, trendline cleared, and EMA retest done
If this momentum holds, we could be looking at a move toward $0.1422.
Watch this one closely!
DYRO, NFA

ROSE/USDT LONGThere is a nice Bull Div on momentum on Yalahari B. Money flow not the greatest on the weekly but with BTC so bullish a see a nice move up on this asset. Pull a fib from high to low of the range, the golden pocket fib around 0.30cents. I expect to clear all vector candles and zones on the way up!

ROSEUSDT Key Inflection Zone Amidst WXY Corrective StructureROSEUSDT is currently exhibiting a broad bearish corrective structure, taking the form of a potential WXY complex correction. Price action has been coiling within a structurally significant range, with the immediate demand zone acting as the current base of accumulation. This area presents a favorable risk-reward opportunity for strategic long positions.
The broader outlook hinges on the behavior of price upon retesting the overhanging supply zone. A rejection at this critical resistance could trigger a sharp bearish continuation, with downside targets aligned with the projected bear zone, as depicted on the chart.
Conversely, a confirmed breakout above this structural ceiling would invalidate the bearish thesis and pave the way for an impulsive bullish leg toward the upper bull target area, establishing a potential trend reversal.

ROSEUSDT | Long | Technical Bounce + Strong Backing | (May 2025)ROSEUSDT | Long | Technical Bounce + Strong Backing | (May 2025)
1️⃣ Quick Insight:
ROSE has been in a downtrend for a while, but it's now showing some promising signs both technically and fundamentally. Price action is shaping up well, and I’ve decided to enter spot at the current level.
2️⃣ Trade Parameters:
Bias: Long
Entry: Market entry at current price
Stop Loss: $0.02000
TP1: $0.04667
TP2: $0.09399
TP3: $0.15275
Partial Exits: Around $0.03167 for a lighter position trim if needed
3️⃣ Key Notes:
Let’s quickly go over what ROSE is. It’s the native token of the Oasis Network—a Layer 1 blockchain designed for scalability, DeFi, Web3, and privacy. What makes it stand out is its confidential smart contract system and a unique architecture tailored for data tokenization.
The Oasis Network is backed by major players like Google, BMW, and institutions like Cambridge, Oxford, and UC Berkeley. The founder is Dawn Song, a professor at UC Berkeley, and the CTO is Raymond Cheng.
Competitors include Secret Network and NEAR Protocol, especially when it comes to privacy and interoperability. Future developments for ROSE include building bridges, strengthening privacy features, and expanding its ecosystem.
With strong fundamentals and a technical structure that’s holding well, this could be a solid long-term play with layered take-profit zones.
4️⃣ Follow-up:
If the structure continues to hold and volume picks up, I’ll consider updating this idea. For now, I’m keeping an eye on how it performs around the first TP level.
Please LIKE 👍, FOLLOW ✅, SHARE 🙌 and COMMENT ✍ if you enjoy this idea! Also share your ideas and charts in the comments section below! This is best way to keep it relevant, support us, keep the content here free and allow the idea to reach as many people as possible.
Disclaimer: This is not a financial advise. Always conduct your own research. This content may include enhancements made using AI.

Reversal Alert: $ROSE Clears Trendline, Next Stop $0.060?$ROSE/USDT is showing early signs of a potential trend reversal. After months of respecting a strong descending trendline, price has finally broken above it and is now consolidating just below a key resistance zone.
This area aligns with both the previous supply and the 50 EMA, making it a critical level to watch.
A confirmed close above this resistance, backed by strong volume, could trigger a bullish continuation toward the $0.044 and $0.060 levels.
DYOR, NFA

#ROSE/USDT#ROSE
The price is moving within a descending channel on the 1-hour frame and is expected to break and continue upward.
We have a trend to stabilize above the 100 moving average once again.
We have a downtrend on the RSI indicator that supports the upward move with a breakout.
We have a support area at the lower limit of the channel at 0.02800, which acts as strong support from which the price can rebound.
Entry price: 0.03023
First target: 0.03100
Second target: 0.03200
Third target: 0.03300

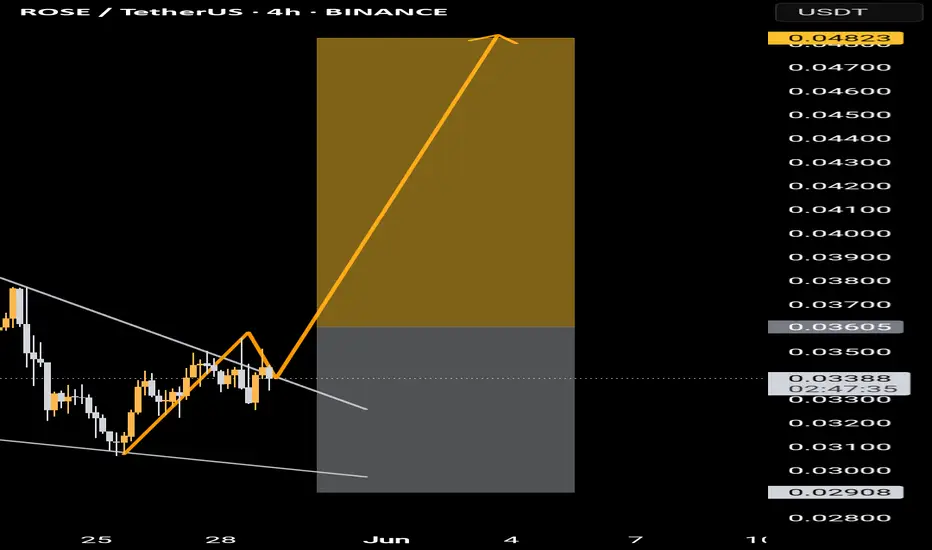
ROSEUSDT 1D#ROSE has broken the falling wedge pattern to the upside and now is facing the EMA50 on the daily chart. In case of a breakout, the targets are:
🎯 $0.03667
🎯 $0.04832
🎯 $0.06634
🎯 $0.08090
🎯 $0.09546
⚠️ Use a tight stop-loss.


ROSE — Quiet Strength Before the BloomClean entry on ROSE at 0.02436, with another limit order ready on margin at 0.02367. The price action has been subtle, but the setup hints at accumulation. If bulls hold the range — upside could come quick.
Watching for a grind-up toward:
0.02462 → 0.02498 → 0.02559 → 0.02621 → 0.02682
Stop set at 0.02306 — controlled risk, promising potential. This one’s for patient hands — could pay off well.
More thoughts in my profile @93balaclava
Personally I trade on a platform that offers low fees and strong execution. DM me if you're curious.

#ROSE Bouncing from Key Demand Zone!#ROSE Bouncing from Key Demand Zone!
ROSE just tested a strong support area and is showing signs of reversal. RSI is recovering from oversold levels—momentum could be shifting!
🔹 Current Price: $0.031
🔹 First Target: $0.05
Could this be the start of a major uptrend?
Retweet if you're bullish!
#Crypto #Altcoins

You won’t believe how bearish ROSE is! (1W)A lot of data is now available on the rising pattern of ROSE. It appears that a large triangle has been completed, which was our wave B.
With the break of the B-D trendline, the triangle is now finished, and we are currently in wave C. Wave C is bearish and should take more time than the large wave A.
ROSE is expected to remain bearish for the next few months, but keep in mind that before the drop, it may pull back to the multi-week supply zone.
Let’s see how it plays out.
For risk management, please don't forget stop loss and capital management
Comment if you have any questions
Thank You

Wave 3: The Moment of TruthWave 3 has awakened.
This is not just another move, not a fleeting rally. It is the raw force of the market in its purest form. Everything Wave 2 tried to suppress—fear, doubt, hesitation—is now a thing of the past. The correction served its purpose: to separate the weak from the strong, to prepare the ground for the inevitable.
But now, Wave 3 takes control.
No resistance can hold it back, no barrier can stand in its way. This is the moment when the trend is no longer a possibility but an undeniable reality. It is the phase where those who believed are rewarded, where patience transforms into power.
The stored-up energy is unleashed with force, with urgency, with direction. Those who doubted will watch in awe. Those who endured will feel certainty coursing through their veins. This is the moment that defines history.
Wave 3 does not ask. Wave 3 dominates.

Get Her ROSE for Just 4 Cents This Valentine!Hello TradingView Family / Fellow Traders. This is Richard, also known as theSignalyst.
🌹Instead of spending tens of bucks on a few roses this Valentine’s Day, get her hundreds of ROSE tokens—she'll thank you later!
📈ROSE has been overall bearish trading within the falling blue channel and it is currently approaching the lower bound of the channel.
Moreover, the $0.03 - $0.05 zone is a strong support.
🏹 Thus, the highlighted blue arrow zone is a strong area to look for buy setups as it is the intersection of support and lower blue trendline acting as a non-horizontal support.
📚 As per my trading style:
As #ROSE approaches the intersection zone, I will be looking for bullish reversal setups (like a double bottom pattern, trendline break , and so on...)
📚 Always follow your trading plan regarding entry, risk management, and trade management.
Good luck!
All Strategies Are Good; If Managed Properly!
~Rich

ROSE in Key Accumulation Zone: Reversal on the HorizonLSE:ROSE is trading within a key Accumulation Zone around $0.04, overlapping with a strong demand area that has historically triggered price recoveries.
> $0.035–$0.045 remains a critical demand zone, attracting buyers.
> A bounce from this zone could target resistance levels of $0.07–$0.08.
> RSI is near oversold conditions, hinting at weakening selling pressure.
If ROSE holds above this support, a bullish reversal is likely. A breakdown below could lead to further downside.
DYOR, NFA

$ROSE at supportRose is sitting on its weekly support, and if confirmation is received, you can enter.
Don't forget the stop loss!
