short-term outlook from $roseusd #oasisnetwork my short-term outlook from $roseusd #oasisnetwork
will $roseusd manage to hold above 0.055$?
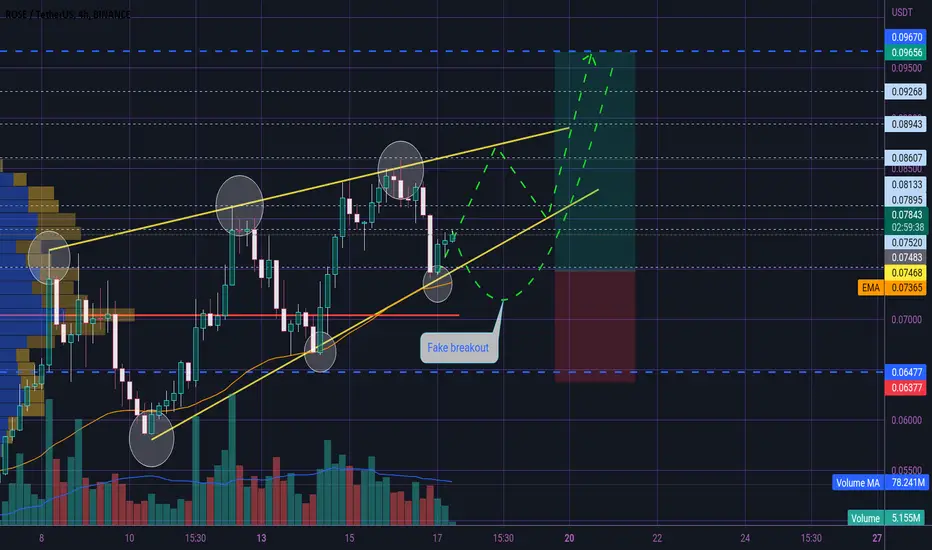
in my opinion 0.055$ is the last support we have before we see much lower prices. Due to the large volume leak.
is the over -6% enough for us today to gain enough buying power?
as long as we stay above the 0.055$, we have enough time to do so.
can we see a price of 0.08$ in the next few days?
based on factors i can go into later, i see our first price target at 0.08$.
at a purchase price of 0.05915, that would be an RRR of 1:5.
I want to hear your opinion
ROSEUSDT trade ideas

ROSE - Very sexy!Recent market observations reveal that the price line of Rose is approaching the tip of a triangular pattern while clouds are beginning to converge, suggesting a shift in the market's volatility. Such patterns are often associated with a range of potential scenarios, each with varying degrees of unpredictability.
However, by conducting a thorough analysis of BTC and BTC.D charts, a potential trading opportunity has emerged. With careful consideration of the charts, it is possible to execute orders at this critical point, with a target range of 0.7 to 0.85.
It is important to note that market conditions are inherently uncertain, and all investments carry risks. As such, investors and traders should exercise caution and perform due diligence before making any investment decisions.


ROSE LONG Reasons to be long on rose/usdt
. With a huge bullish divergence on the RSI 1H time frame
. Bullish order block
. Oversold RSI H1
Unfortunately for altcoins they don't usually move independently of BTC, especially when btc is bleeding it causes alts to bleed even more. With this in min this is a great long opportunity for a swing trade back up to local highs, however if BTC decides maintain its SFP (swing fail pattern) then a stop loss under the most recent higher low would confirm bearish structure and the trade has failed.

ROSE targets above Rose/Usdt #ROSE #roseusdtHere we see our Rose 3 day chart .You can see that dark blue 200 MA line above us near .1472 and I think that's definitely a target we'll be going towards soon . But if we follow FET and break over that dark blue 200 MA then what are the targets above there ? Because we're going to look for the possible top of this run . Well, for that we have to look at our fib lines . That's our fibonacci lines . These are often an area that gets revisited on any altcoin chart . And for ROSE tether pair we can see to the right hand side of the chart there are some dotted lines and those are next to the probable target price areas . First target is the .618 fib near 38 cents . If other altcoins are running up to these levels then we can expect to probably see Rose go up there too . Next target is the .65 fib near 40 cents - this .65 fib is called "The Golden Fib " and could definitely be a top target . The last target for now and possible top could be the .706 fib near 43 cents - this .706 fib is often thought of as a reversal area as well . So if our possible alt run continues then we could look for these targets . At this point most people think Bitcoin bottom was in back in November and that the market is going back up - at least for awhile . Let's see .


🔥 ROSE Bearish ChannelROSE is a very weak token at the moment. I'm looking for a continued bear move towards the bottom of the channel.
Once we trade at the bottom of the channel it might be a good time to scout a long entry. Till then, patience.


ROSE ...... LONG/SHORt episode 2I dont feel i should give an explanation...
some times this tech did worked for me...
i think u should do ur own analysis
ROSE Might Run Away :)
never a financial advice
Just Do ur research, IF I AM WRONG, PLZ GUIDE ME

ROSE 🌹Bullish Pattern 🙂🎯🙂🎯🙂Hi dear traders
The price has formed bullish pattern.
If pattern confirmed and price hold above support area 0.05802 , we can open long position.
Wait ✋for confirmation for entery.
We are trying to take profit 📈 in short term.
All targets specified.
Let's see what happens
This is not financial advice ( DYOR )
Good luck


ROSE nice AI play this yearROSE top tier AI token. Recently partnered with personal.ai. MACRO PICTURE

Oasis Network (ROSE) completing a BAT for upto 38% rallyHi dear friends, hope you are well and welcome to the new trade setup of Oasis Network (ROSE) with US Dollar pair.
Previously we caught more than 54% pump of ROSE as below:
Now on a daily time frame, ROSE is about to complete a bullish BAT move for another bullish reversal move.
Note: Above idea is for educational purpose only. It is advised to diversify and strictly follow the stop loss, and don't get stuck with trade

ROSEUSDT wants the breakout? The current price of ROSEUSDT is inside a descending channel after breaking out from the daily resistance level.
A descending channel is a technical analysis pattern that is formed when the price moves between two downward sloping trendlines. The upper trendline connects the highs, while the lower trendline connects the lows. In a descending channel, the price tends to move lower, bouncing off the upper trendline and finding support at the lower trendline.
In the case of ROSEUSDT, the price is currently trading within this pattern, indicating a bearish trend. This means that sellers are in control and are pushing the price lower. However, the fact that the price broke out of the daily resistance level suggests that there may be some bullish momentum building.
For traders looking to enter a long position in ROSEUSDT, they would need to wait for a breakout from the descending channel and ensure that the breakout satisfies Plancton's rules. Plancton's rules are a set of technical analysis guidelines that aim to identify high-probability trading opportunities. These rules include looking for strong trends, clear price patterns, and confirmation
–––––
Follow the Shrimp 🦐
Keep in mind.
🟣 Purple structure -> Monthly structure.
🔴 Red structure -> Weekly structure.
🔵 Blue structure -> Daily structure.
🟡 Yellow structure -> 4h structure.
⚫️ Black structure -> <= 1h structure.
Follow the Shrimp 🦐

ROSE 🌹 ASCENDING WEDGE 😊☄😊☄😊Hi dear traders
Price moving in Ascending Wedge.
Now in support area we can open long position and take some profit 📈.
It's possible to fake breakout it.
As you can see ,set stop-loss below this area.
All targets specified.
Let's see what happens
This is not financial advice ( DYOR )
Good luck
ROSEUSDT long review entering at 0.073 at the previous HTF top now that price has accepted above this level seemed like a good place to build a long position.
The exit could have been improved, the bearish OB at 0.083 would have been better and price did reach it before turning short term bearish.

ROSEUSDTHello Crypto Lovers,
Mars Signals team wishes you high profits.
This is a 4-hour-time frame analysis for ROSEUSDT
R1 in this chart are our resistance area and includes the disability of the price to rise. And we have S1 that used to be a resistance area in the past. Hence, we see the price was rejected at several points at the white line (a resistance line) and then by having a neutral fluctuation between R1 and S1, it is now moving below R1. We believe it will have its falling trend due to the existence of a red candle here and via providing us some confirmation candles to fall, a decline would happen for the price toward lower amounts. Or possibly by giving us some rising signs, there would be an increase to higher amounts in case the price gives us some rising signs and a rise happens surely. The point is that if you are looking for wise trades and less risky ones, our suggestion will be following our regular updates.
Warning: This is just a suggestion and we do not guarantee profits. We advise you to analyze the chart before opening any positions.
Wish you luck

$ROSE Oasis Network Swing Trade Idea$ROSE Oasis Network Swing Trade Idea. Marketed levels for swing positions.

Rose trend break.There is a pretty tasty short on rose. Watch the micro structure shown for price agreement.

Rose / Usdt Price Prediction Rising Wedge Pattern In 4 Hour Time Frame May Be Rose Break Down Side And If Rose break Daily Sport Level ( Which is what you see in the picture ) Then Rose Go Down Good For Short.
But If Rose Break 0.618 Fib Level Andy Retest And if Price Price Hold 0.618 Levl Then Good For Long

Rose / Usdt Price prediction Rising Wedge Pattern In 4 Hour Time Frame May Be Rose Break Down Side And If Rose break Daily Sport Level ( Which is what you see in the picture ) Then Rose Go Down Good For Short.
But If Rose Break 0.618 Fib Level Andy Retest And if Price Price Hold 0.618 Levl Then Good For Long

ROSEUSDTA clear bullish peanut pattern for rose is coming. After confirmation, it worth opening a long position

ROSEUSDT wants to go higher?ROSEUSDT has made more than 35% since your previous idea, and the market has experienced a breakout from the descending channel.
The descending channel is a bearish technical pattern in which the price action of an asset moves downward within two downward sloping trend lines.
A breakout is a significant price movement that occurs when the price exceeds the boundaries of a previously established pattern or trend.
Now, the price of ROSEUSDT has experienced another breakout from another descending channel, indicating a potential change in trend from bearish to bullish. As a trader, you are waiting for Plancton's rules to be met in order to enter a new long position and potentially profit from the stock's upward momentum.
By waiting for the conditions outlined in Plancton's rules to be met, you can make informed trading decisions and potentially increase your chances of success.
–––––
Follow the Shrimp 🦐
Keep in mind.
🟣 Purple structure -> Monthly structure.
🔴 Red structure -> Weekly structure.
🔵 Blue structure -> Daily structure.
🟡 Yellow structure -> 4h structure.
⚫️ Black structure -> <= 1h structure.
Follow the Shrimp 🦐
