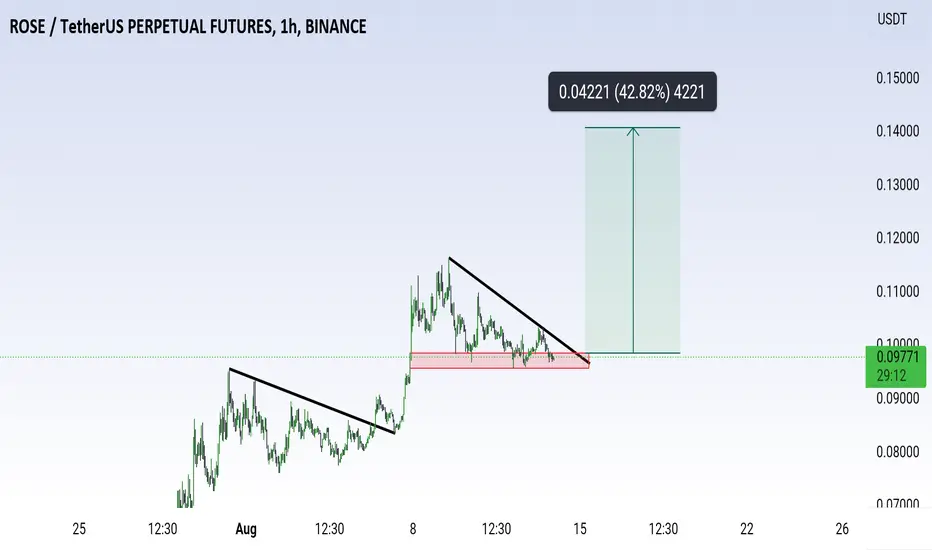
ROSE is getting ready for another pumpIn case of upside trendline breakout we will see another 40-50% rally..
Keep an eye on rose
ROSEUSDT trade ideas
ROSE growth according to the price actionAccording to our setup,ROSE is prone to grow up to the specified area

Best chance of success for buy rose Hi guys
This is a good opportunity to trade
In terms of rtm and classic


Rose Ichimoku bounce on Daily could send us very bullishIf bitcoin does well here, we can see a huge increase of the Rose token in the short to mid term.
I have drawn out some lines for fun of different scenarios both if this fails and if it succeeds


ROSE/USDT might crash down for correction!Hey Traders,
Last coin for today will be ROSE coin. There is not much to say about this coin, project itself is interesting and we had a great breakout from first flag formation but we see that on the second flag the volume is just not the same. We are waiting for some confirmational movements from here so that we can take a short position here
If you like ideas provided by our team you can show us your support by liking and commenting.
Yours Sincerely,
Swallow Team 🔱
Disclamer:
We are not financial advisors. The content that we share on this website are for educational purposes and are our own personal opinions.


Eyes on roseClose eye on Rose here, we break the longterm trendline, it could go big(3x), big buying volume has entered.


$ROSEUSDTPERP | T1 Base breakout Stop market order @ m15 inside bar
RRR 6.0
0.5 % VAR
Daily timeframe notes:
Price above all major SMAs
Fresh break above daily continuation pattern

Rose/usdt risingrose/usdt will be rising after breakout price level . strong support break and continue rising

ROSEUSDTIt has poke the supply zone and reverse a little on higher time it's showing small rejection

ROSE - Potential SHORT -15MIN/1HR - Binance for BINANCE:ROSEUSDTTrading view post:
Trade Status: ACTIVE
Trader: Drizzzled (AUS)
Trade Type: SHORT
(RE-ENTRY above previous entry post)
Entry 1: 0.10979
Entry 2: 0.12074
Entry 3: 0.13565
Entry 4: 0.15439
Entry 5: 0.17121
Stop Loss: for entry 1: 0.11534 or 1:1 or to own personal risk factor.
-.618 4hrly
Take Profit Targets:
-0.09927
-0.09050
-0.08236
-emas will rise with time so shift tp up accordingly. If we re-enter higher, our same emas become our take profits. Also a have put boxes around key sippprts which I may choose to take earlier or later profits at too.
Comments: move stop loss to break even once target 1 is hit. DCA entries above if stop loss is hit. Message me for more entries if needed.

ROSE USDT Strong Reversal Pattern for BuyingAnalysis:
Price touching key support, neckline break, forming rally base rally / flag pattern.
Strategy :
long
SL: below flag formation
TP: as illustrated, with thick supply area maybe destroyed by bull power, wait for the next price action happen.
Disclaimer:
There's no 100% accurate prediction & strategy. Force majeure & institutional trader action maybe happen any time. Please use your money management well.

OASIS ($ROSE) & Fib chanelThey have a good news (partnership with Meta) when price under $0.05, at level 1.618 ( of Fib chanel).
If this partnership is successful and renewed, I think the price of $Rose will at least rise to $1.6.
The bad thing is if things don't go well and Meta will stop cooperating.
And now is not a bull market season, we will expect that in the future.

flying roseAccording to our strategy, this currency has the possibility of good growth from this point

Happening fourth wave down to 0.07175On 2h TF
After BINANCE:ROSEUSDT has reaching to 0.0955 and pulling back to 0.07175, perhaps.
Need to consolidate before pump to 0.1169


Great opportunity one Still bullish so you can still look for a buy after the pulback or retracement of the price on the 0.618 fibonacci level
entry: 0.086$ or 0.084$
SL: 0.082$
TP1: 0.09$
TP2: 0.095$
TP3: 0.11$
NB: always put the part of your money that you can afford to lose

ROSEUSDT Symmetric Triangle breakout! ROSEUSDT Technical analysis update
Buy zone: $0.084 - $0.086
Stop loss : $0.0795
TP 1 : $0.090
TP 2 : $0.095
TP 3 : $0.103
TP 4 :$0.113
Max leverage: 2x
Always keep stop

