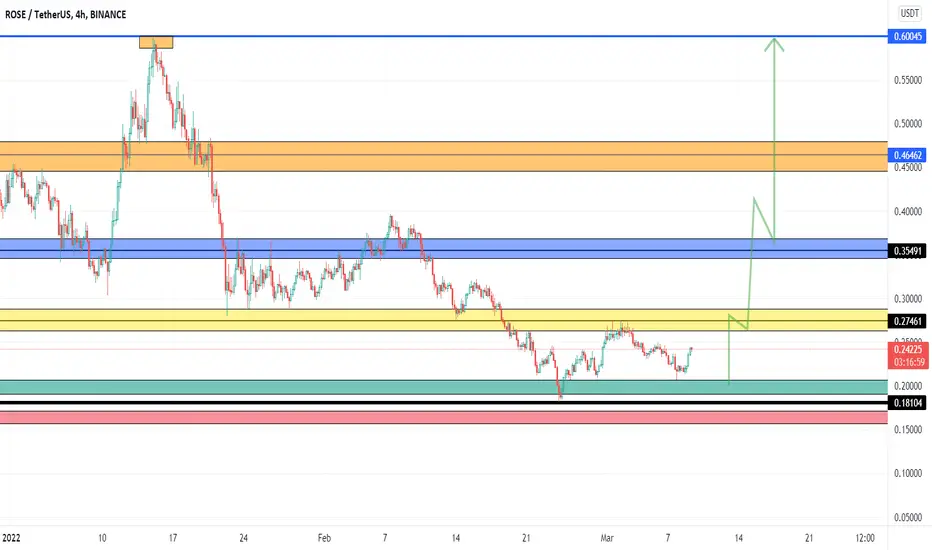
ROSE - Detailed Video Analysis & Market Structure!Hello TradingView Family / Fellow Traders. This is Richard, as known as theSignalyst.
Here is a detailed update top-down analysis for ROSE.
Which scenario do you think is more likely to happen? and Why?
Always follow your trading plan regarding entry, risk management, and trade management.
Good Luck!
All Strategies Are Good; If Managed Properly!
~Rich
ROSEUSDT trade ideas

ROSE finally break downtrend Zone Ready to PUMP 🚀⛽🚀BINANCE:ROSEUSDT
Keep eyes on it 👀🕵️👁️
Don't forget Financial management and step
by step purchasing 💹💰💵💲
Please fallow me 🙏🥺
Please leave comments 🗨️💬
Like and share with your friends 👍💑
I hope you enjoy ☺️🌈🎉🎊🎁

🆓Oasis Network (ROSE) Mar-13 #ROSE $ROSE
ROSE just closed the 1D candle with the Inverted Hammer pattern, which shows that the buying force has stopped the selling. However, ROSE can still correct to the $0.2 area before strongly increasing to the $0.4 area in the near future.
📈RED PLAN
♻️Condition : If 1-Day closes ABOVE 0.2$ zone
🔴Buy : 0.22 - 0.2
🔴Sell : 0.28 - 0.34 - 0.4
📉BLUE PLAN
♻️Condition : If 1-Day closes BELOW 0.2$ zone
🔵Sell : 0.2
🔵Buy : 0.16
❓Details
🚫Stoploss for Long : 10%
🚫Stoploss for Short : 5%
📈Red Arrow : Main Direction as RED PLAN
📉Blue Arrow : Back-Up Direction as BLUE PLAN
🟩Green zone : Support zone as BUY section
🟥Red zone : Resistance zone as SELL section

$ROSE BULLISH SIGNSHELLO GUYS AND THX FOR SUPPORT.
-It is clear that an ABC BULLISH triangle has formed, complete at point C, and we confirm this by arriving at three strong intersecting support logics:
1- The mid-line of the ascending channel
2- Touching M50, which is also a strong support line
3- The horizontal strong support area, which was a resistance area in the past.
According to what this triangle tells us, we should BUY at the top of the second candle following point C, and we place the stop loss exactly at point C.
The targets are defined by drawing, and they are completely compatible with the support and resistance lines of the ascending price channels.
- If the price breaks the stop loss, it will head to the line of the channel and from there it will go back up.
WHAT DO YOU THINK?


Rose downward channel$Rose #oasisnetwork downward channel running into LTF support. Breakout and I will look for the .236 as TP. Breakdown and I will look for retest of bottom fib. Potential paths listed.
——————————————————————————————
Top 10 trading tips:
1. DO NOT FOMO into a trade. Let it come to you. Don’t force it.
2. Find a strategy that works for you and be consistent. Operate like a machine and less like the wind.
3. Let your winners run and cut your losers short.
4. You will not win every trade, but if you are disciplined with great RM you don't need to be right all the time to win!
5. Before you enter a trade, know your target AND your exit strategy.
6. When you are up, you can use a trailing stop or trim off some profit at a logical resistance point with a stop loss at breakeven.
7. Set your trade parameters up front so you keep your self accountable and remove emotions from the equation. (stop loss, take profit levels, etc)
8. Don't fight the trend. The trend is your friend.
9. Don’t enter a trade based on one indicator.
10. Horizontals > Diagonals
Please note:
- This is not financial advice.
- I do not take every trade I post.
- Never trade off of someone else's chart until you DYOR!

🔥 ROSE Following Summer-21 Fractal: Huge Returns PotentialROSE is seemingly following a trading pattern which almost exactly resembles the pattern that ROSE followed earlier in the summer-21 bear market.
Assuming that ROSE will follow this fractal, it signals that there's more potential downside risk before we can see another bullish move again. Furthermore, this fractal signals that the $0.18 area is the bottom, and we will visit it again.
In case you're looking for a long-term trade, ROSE might be a good bet.
Happy trading!

Give me a $ROSE for this Post-Val'ntine ;p$ROSE :
One of the best charts that I worked in terms of Analysis.
Not to deny the fact that It may go completely wrong ;p but still IMO :
Scenario 1 :
It might try to break the Minor resistance line just to get rejected to reach 0.0 Lvl (0.18$) - where Imma eyeing to enter (Spot).
Scenario 2 :
It might try to break the Minor resistance line & further move up towards 0.618 Lvl (0.41$) where it may see an Oversold positions
& hence leading to 0.0Lvl (0.18$).
IMO : $Rose may complete its Parabolic Step cure Trend after forming an ATH around 0.75$
by what it means is it should have completed smaller parabolas (which is what is shown in the chart).
Happy trading.,
Not a financial advice.

OASIS NETWORK - SHOWS THAT ITS THE CYCLE TREND COIN -GREEN TRENDHello trading friends,
We know traders - and there are investors - that want to build capital for the long term.
I did follow the oasis network for the long term - I find personally this coin has a good effect on cycle trend - depending on algorithm counting trend it shows its one of the coins that stay into the green cycle trend formula, even with the breakdown of the markets include - Rose - what this could mean into long term a great option - but same time know that there is noting guaranty into crypto.
One of the best ways is to buy dips into markets in general - with a part of the investment.
this idea going fully on the long-term trend and spot - and also on the cycle trend of this coin - until now this coin is not broken out of the cycle, and still going on the green cycle - even with all breakdown trends, we have seen on the markets.
We will follow the coin coming time - into the long-term cycle to see the trends.
Don't expect to fast price action - sometimes market going on their way.
There is no reason to buy any coin directly - manage always the risk first - and check which cryptocurrencies are for you interesting depending on your setups - sometimes waiting first for a re-test is a good idea.
Have good time

ROSE - Oasis network still into green cycle for long termHello trading friends,
This is an update for Rose - Oasisnetwork
Depending on the long-term cycle trend - Rose is still interesting - the reason for the breakdown depends on all markets.
Data shows that Rose - is still into the long-term green cycle - for this reason, ts interesting to watch it out.
Depending on the long term it's possible that we can see NEW ATH.
Know that markets can take some time before it shows an effect - and same time markets don't go into 1 line to target.
Soon when there is more data, we will be able to share more Oasisnetwork charts.
Have a great day.

Rose will go
Entry
0.212 : 0.224
Target :
1️⃣0.235
2️⃣0.237
3️⃣0.244
4️⃣0.259
5️⃣0.275
6️⃣0.3
Stop losse
0.210
It is not considered advice for trading, trading is your responsibility and your decision

ROSE\USDTThis coin is moving relatively well with the bearish market movement >> This is not a breach of the price channel , but this is a correction for the consolidation to return to the upside.. We should see an increase in the momentum >> i placed order on = 0.17


Rose forming head and shoulder shapeRose is forming head and shoulder shape on 15 min time frame.
You can short it . Target would be near 0.2375 or safer to end at 0.238
Follow for more ideas
Do your own research and trade safely

ROSEUSDT is going to create a falling wedge
The price had a huge bearish impulse, bounced on the weekly support on 0.3$ and had a new breakout.
The price retested the previous support as new resistance and the market went to test again the previous weekly support on 0.2$.
Connecting the lows and the highs, the price is creating a falling wedge exactly on the weekly support.
How to approach?
We are monitoring the price, we could see a double bottom on the weekly support. IF the price is going to have a breakout from the falling wedge and 4h resistance, and turn the previous resistance into new support, According to Plancton's strategy , we can set a nice order
–––––
Keep in mind.
🟣 Purple structure -> Monthly structure.
🔴 Red structure -> Weekly structure.
🔵 Blue structure -> Daily structure.
🟡 Yellow structure -> 4h structure.
–––––
Follow the Shrimp 🦐

$Rose buy the button Still think $Rose is layer 1 sleeping gIant not financial advice I expect 1$ eoy
Hodl
Dnt forget to take profit along the way

🔥 ROSE Breaking Out?Recently I made a short-term analysis on ROSE, which has played out well. Today I want to take a look at a longer-term pattern in which ROSE has been trading.
Over the last few months, ROSE has been trading bearish alongside a very distinct bearish trend line. Earlier today, ROSE rejected from the trend line and lost a couple of percent. However, there's still a decent chance that ROSE will break out through this resistance in the coming days, assuming BTC will remain neutral at least.
In case of further bad news, expect ROSE to fall further yet again. The lower bound of the falling wedge pattern will offer support in this case.
Happy trading!


Rose 4h chart:
1. Double top (Green line) price DOWN
2. Cup and handle paternn price UP
This is not financial advice just idea.

RR: 2 sell ideabearish harmonic pattern
rising parallel channel
rsi divergence
breakout
never risk more than 2% of capital per trade

