Alikze »» Rose | Ascending corner pattern🔍 Technical analysis: Ascending corner pattern
- In the daily time frame, in an ascending channel, according to the predicted path, it has grown up to 1.618 fibo of the previous wave, a range of 0.17.
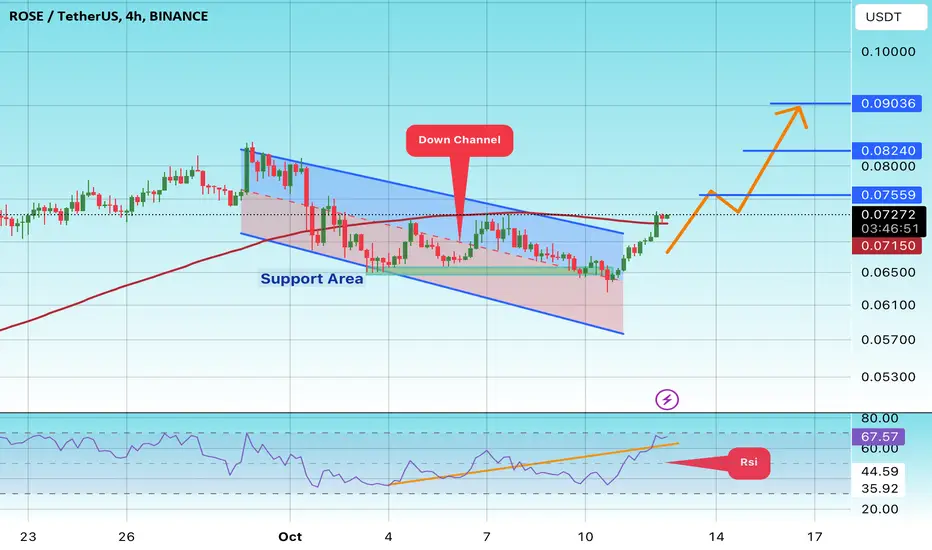
- In the last analysis presented in the 4H time frame in an ascending channel, after breaking the channel and exiting it and breaking the zone, it experienced a correction.
- In the daily time frame, it has had a complete upward cycle, and wave 3 has grown as much as 1.618 of the previous wave.
- At the moment, correction is done as much as 0.23 fibo of the whole structure.
- A corner pattern has been formed which can grow up to the supply area by breaking the 0.072 area.
🛑 The most important resistance: ~ 0.072
💎 NOTE: In addition, if the 0.23 area breaks and stabilizes below it, the bullish scenario will be invalidated.
»»»«««»»»«««»»»«««
Please support this idea with a LIKE and COMMENT if you find it useful and Click "Follow" on our profile if you'd like these trade ideas delivered straight to your email in the future.
Thanks for your continued support.
Best Regards,❤️
Alikze.
»»»«««»»»«««»»»«««
BINANCE:ROSEUSDT
ROSEUSDT trade ideas


SPOT ROSE LONG 30.11.2024🎯Purpose:
0.11789
‼️We enter at 0.5% of the allocated money for spot trading.

RoseusdtRose looking good here , I would buy spot though if going heavy or if leverage make sure to know how to use it. Great coin for this bull run.

Oasis Network (Rose)If we look at the Rose behavioral patterns, it looks like a sinusoidal wave in which the amplitude is increasing logarithmically. So, doing simple math, when the next sinusoidal wave starts it has to go up about 2000% 😵
What do you think?

ROSE / USDT: gearing up for breakout ROSE/USDT: Gearing Up for a Breakout
ROSE/USDT is shaping up for an exciting move 📈 as it approaches a critical trendline resistance zone 📊. The price has been consolidating tightly, creating the perfect setup for a potential breakout 💥. If the breakout happens, we could see a strong bullish trend unfold 🚀. Keep a close eye 👀 on this pair and wait for confirmation before acting.
Key insights:
1. Trendline resistance: ROSE/USDT is approaching a long-standing trendline that has previously acted as a barrier. A break above this could mark the start of a strong upward move.
2. Volume surge: Watch for a significant increase in trading volume during the breakout to confirm buyer strength 🔥.
3. Bullish signals: Momentum indicators like RSI and MACD are trending positively ⚡, supporting the case for a bullish breakout.
Steps to confirm the breakout:
Look for a clear 4H or daily candle closing above the trendline 📍.
A noticeable spike in volume during the breakout can signal strong buying activity 📊.
A retest of the broken resistance as a new support zone adds credibility to the move ✅.
Be cautious of fake breakouts, such as sharp reversals or wicks above the trendline ⚠️.
Potential targets (post-breakout):
Risk management strategies:
Use stop-loss orders to manage your risk effectively 🔒.
Ensure position sizing aligns with your overall trading strategy 🎯.
This analysis is for educational purposes only and not financial advice. Always conduct your own research (DYOR) 🔍 before making investment decisions.

ROSE (Descending Channel) 203% Potential Welfare Chart WednesdayHello Traders,
For the last one of our collection today we decided to go with Rose as we stick in the top 200 market cap coins chart's this week for Welfare chart and education with Oasis ticker ROSE currently sitting at a cool 126 on the overall market cap. The indicators on the RSI and MACD look good. I have removed them to see the structure of the trade which is the most important of all chart indications of a trade.
This coin is currently sitting in an descending triangle, which is generally a bullish pattern (77%-78% bullish chance of hitting target) with a total of 203% full potential as we added the second target onto this coin for you to see for a Black Friday gift.
Education below
Oasis Network (ROSE) - The Privacy-First Blockchain for DeFi, NFTs, and Beyond
Overview:
The Oasis Network is a privacy-focused, scalable blockchain designed to enable decentralized finance (DeFi), data tokenization, and privacy-preserving applications. Unlike traditional blockchain networks, which prioritize transparency at the cost of privacy, Oasis provides a unique infrastructure that allows users to control their data and interact with decentralized applications (dApps) in a secure and private manner.
At the core of Oasis is its confidential computing technology, which allows private data to be used in smart contracts and DeFi protocols without exposing the data to the public. This ability to process private data securely is a game-changer, particularly in industries like finance, healthcare, and supply chain, where privacy and compliance are paramount.
The ROSE token is the native utility token of the Oasis Network, and it is used for staking, governance, and transaction fees. ROSE holders participate in securing the network and have a say in the future direction of the project, making it an essential asset within the Oasis ecosystem.
What Makes Oasis Network Unique?
Oasis Network’s unique features set it apart from other blockchain projects, particularly in the areas of scalability, privacy, and tokenized data. Here are the key features that define Oasis:
Privacy-Preserving Smart Contracts: Oasis uses paratrees, a multi-chain architecture, to enable private smart contracts that can run on encrypted data. This allows sensitive information (e.g., medical records, financial data) to be processed without being exposed to the public.
Confidential Data Processing: Through its Confidential Compute technology, Oasis provides a secure way to process private data. This feature opens up new possibilities for industries that rely on data privacy, such as healthcare, finance, and identity management.
Scalability: Oasis uses a staking layer and paratree architecture to achieve scalability while maintaining high security. By separating consensus and execution layers, Oasis is able to scale effectively without sacrificing decentralization or security.
Data Tokenization: Oasis allows the creation of data tokens—digital assets that represent real-world data. These tokens enable secure, tokenized access to private data for businesses and individuals, creating new opportunities for data monetization and privacy-focused DeFi applications.
Ethereum Compatibility: Oasis is fully compatible with Ethereum, enabling developers to port their Ethereum-based applications to the Oasis Network easily. This enhances its utility and ensures it can tap into the growing Ethereum ecosystem.
The Investment Case for ROSE
As blockchain adoption accelerates, privacy and scalability are becoming increasingly important. Oasis is uniquely positioned to lead the way in both areas, providing a privacy-first solution for decentralized finance and beyond. Here’s why ROSE could be an excellent investment:
Increasing Demand for Privacy: With the growing concerns about data privacy and protection, Oasis addresses a crucial gap in the blockchain space. Many DeFi protocols, while offering transparency, lack privacy features that are critical in industries like finance, healthcare, and government. Oasis bridges this gap, making it a compelling solution for privacy-conscious users and enterprises.
A Strong Focus on DeFi and Tokenization: Oasis is built with the future of decentralized finance and data tokenization in mind. As the DeFi space continues to grow, Oasis’s ability to offer private, scalable, and secure DeFi solutions could position it as a leader in the sector.
Partnerships and Ecosystem Growth: Oasis has formed strategic partnerships with key players in the blockchain space, including Coinbase, Binance, and other DeFi projects. These partnerships expand the Oasis ecosystem, increasing its adoption and the utility of the ROSE token.
Governance and Staking: ROSE holders participate in the governance of the network, allowing them to vote on protocol upgrades, parameter changes, and other key decisions. This gives investors an opportunity to actively shape the future of the network. Additionally, ROSE is used for staking, providing holders with an incentive to participate in securing the network.
Institutional Adoption: Oasis’s focus on privacy and compliance makes it an attractive option for institutional players who require blockchain technology that meets regulatory and privacy standards. As institutions continue to explore blockchain solutions, Oasis stands out as a platform that meets these needs.
A Brief History of Oasis Network
Oasis Network was founded by Dr. Jianing Wu and Dr. Omar Syed in 2020, with the goal of addressing the privacy limitations of existing blockchain technologies. The project is supported by the Oasis Foundation, which has garnered backing from top investors, including A16Z, Polychain Capital, and Coinbase Ventures.
Oasis started with a strong focus on the privacy aspect of blockchain technology, with its Confidential Compute technology allowing private data to be processed on-chain securely. The project’s mainnet went live in 2021, and since then, the Oasis Network has gained significant traction in both the DeFi and enterprise blockchain sectors.
Key milestones in the history of Oasis include:
2020: The Oasis project raised over $45 million in funding to further develop its network, with backing from major venture firms.
2021: Oasis launched its mainnet, enabling full privacy-preserving smart contracts and data tokenization capabilities.
2022 and Beyond: Oasis continues to expand its partnerships, attract new users, and integrate with key DeFi projects. Its growing ecosystem and strong focus on privacy have positioned it as a key player in the Web3 and privacy-focused blockchain space.
Why Oasis (ROSE) is a Strong Investment
The Oasis Network stands at the intersection of two of the most important trends in blockchain technology today: privacy and scalability. As data privacy becomes an increasingly important issue in both the consumer and enterprise space, Oasis offers a solution that allows users to maintain control over their data while benefiting from the advantages of decentralized finance, NFTs, and other Web3 applications.
Oasis is uniquely positioned to lead in the privacy-first blockchain space, making it an excellent investment for those looking to capitalize on the growing demand for privacy-preserving solutions. With its strong partnerships, robust ecosystem, and innovative approach to blockchain technology, ROSE tokens offer a compelling opportunity for investors seeking exposure to the future of decentralized finance and privacy.
Helpful Links
Coin Market Cap
coinmarketcap.com
White paper
assets.website-files.com
Stay profitable my friends,
Savvy

$ROSE Has a clear road this year ! As you know, the digital currency LSE:ROSE (Oasis Protocol) is one of the most popular Layer-1 blockchains in the world, known for its high scalability, strong integrity, and fee-less transactions. It has consistently attracted the attention of the cryptocurrency community.
Furthermore, it is no secret that the future belongs to artificial intelligence and AI-based technologies, and "Oasis Protocol" is truly one of the pioneers in the AI space, always having something to say!
For this reason, I decided to analyze its chart from a smart money perspective and present it to you.
Soon, I will provide an update and analysis based on price action.
Thank you very much for your attention 🌹

ROSEUSDTEthereums Privacy L2
usually sees a delayed move when compared to the rest of the larger cap coins...
breaking downtrend..
stoploss and targets shown..

#ROSE/USDT#ROSE
The price is moving in a descending channel on the 4-hour frame upwards and is expected to continue
We have a trend to stabilize above the moving average 100 again
We have an upward trend on the RSI indicator that supports the rise by breaking it upwards
We have a support area at the lower limit of the channel at a price of 0.06500
Entry price 0.07200
First target 0.08240
Second target 0.08299
Third target 0.09000
ROSEUSDT Bullish Channel Breakout!ROSEUSDT Technical analysis update
BINANCE:ROSEUSDT has formed a descending channel, and the price is now moving toward the channel resistance for a potential breakout. The price is trading above the 100 and 200 EMAs on the daily chart, indicating a bullish signal. A breakout above the channel could lead to a strong upward move.
Entry level: Below $0.086
Stop Loss: $0.068
Regards
Hexa

ROSE - Target $0,31 - Triple bottom break outROSE looks great on the weekly timeframe. Price has bottomed out and ROSE can increase the comming weeks up to $0,31.

ROSEUSDT Bullish Surge or a Risky Rejection? Key Levels Area!Yello, Paradisers! Could #ROSEUSDT be on the brink of a major breakout or facing a critical setback? Here's the breakdown:
💎#ROSE has formed a three white soldiers pattern, a classic and powerful bullish indicator. If it successfully breaks out of the descending channel, we could see the price push upward to the key resistance level, confirming a potential Cup and Handle formation. Should ROSE break this resistance, it would solidify the bullish case, with a significant move toward the supply zone as the target.
💎However, if ROSE gets rejected at the descending channel resistance, we might witness the price testing the support zone between $0.066 and $0.062. A rebound from this area would set the stage for another attempt at breaking out of the descending channel.
💎The situation turns concerning if ROSE fails to rebound from the support and breaks down further. This could lead the price to revisit the demand area or even test the major support zone between $0.0524 and $0.049. A rebound from this level and a reclaim of the $0.06 support would be crucial for maintaining the bullish scenario. Conversely, if ROSE breaks below this major support with a daily close under it, it would confirm a bearish shift, potentially pushing the price into a deeper dip.
Consistency is key, Paradisers! Focus on strategic planning, disciplined trading, and the highest probability setups to stay ahead. Keep your eyes on these critical levels and trade smart!
MyCryptoParadise
iFeel the success🌴

$ROSE 20h LTF LongLSE:ROSE
Breaker Block with entry @0.0593ish and SL @0.0583ish
If this level doesn't hold we'll pbby see ROSE testing the 4D BB @0.047ish

ROSE USDT-MUST WATCH THIS ANALYSISIf the price breaks the trendline, then the price can dump further

Oasis Network / ROSEThe price of ROSE is $0.062 today with a 24hour trading volume of 110 million dollars . This represents a 16% price increase in the last 24 hours and a 70% price increase in the past 30 days
Oasis is the leading privacy-enabled and scalable layer-1 blockchain network. It combines high throughput and low gas fees with secure architecture to provide a next-generation foundation for Web3 and will power DeFi, GameFi, NFTs, Metaverse, Data tokenization and Data DAOs.
Rose finally manage to break 0.059 level and jumped to 0.063 and now the next targets are 0.069, 0.075 and 0.079$

ROSEUSDT Bounces Back, Targeting $0.10 After Strong Support TestAfter successfully testing key support levels, ROSE/USDT is showing bullish momentum as it begins to bounce back. With strong buying interest emerging, the price action suggests a potential rally towards the $0.10 mark. Traders should watch for confirmation of this trend, as further upward movement could present profitable opportunities.
ROSEUSDT Currently trading at $0.069
Buy level: Above $0.069
Stop loss: Below $0.0615
TP1: $0.072
TP2: $0.082
TP3: $0.09
TP4: $0.1
Max Leverage 5x
Follow Our Tradingview Account for More Technical Analysis Updates, | Like, Share and Comment Your thoughts

roseusdt possitionThe rose currency is pulling back in the weekly time frame after a good upward movement and mtrch formation. Entry points can be purple and green points, TP is clear in the picture.

ROSEUSDT Set for a Major Breakout or Breakdown?Yello Paradisers! Are you ready to catch the next big move on ROSEUSDT? 🧐 Let’s dive in!
💎Currently, ROSEUSDT has displayed a Change of Character (CHOCH) and has formed a W-pattern on a crucial support zone, which previously acted as resistance. After the breakout, this zone now serves as a potential base for a bullish move.
💎But confirmation is critical! ROSEUSDT needs to break above the previous swing high of the W-pattern and close a candle above it. If this happens, it would significantly increase the probability of an upward move.
💎We may see a bounce from the strong support zone below. However, to validate this, we need an Internal Change of Character (I-CHoCH) to confirm a shift toward a bullish market structure.
💎If ROSEUSDT breaks down and closes candle below the strong support zone, it would invalidate the entire bullish setup and could signal further downside risk.
Stay sharp, Paradisers! Waiting for confirmation is crucial. In this game, patience and discipline will always set you apart from the crowd.
MyCryptoParadise
iFeel the success🌴


$ROSE long idea1w time frame looks super bullish.
Candle closed above trendline.
Pump will be huge when alt season start, prepare your bags.

ROSE/USDT: Potential Big Breakout LoadingThe ROSE/USDT pair is showing signs of a breakout on the daily timeframe. If the breakout is successful, I anticipate a strong bullish movement of 50-100% in the coming days.
Remember, this is not financial advice—always do your own research (DYOR) before making any trades.

ROSE Looks BullishFrom where we placed the red arrow on the chart, it seems that the ROSE correction has started.
This correction has looked like an ABC as we are now in wave 5 of wave C.
We are looking for buy/long positions in the green range.
The targets are clear on the chart.
Closing a daily candle below the invalidation level will violate the analysis.
For risk management, please don't forget stop loss and capital management
When we reach the first target, save some profit and then change the stop to entry
Comment if you have any questions
Thank You
