ROSEUSDT trade ideas


ROSE-USDT LONG/BUYMulti-time Frame Analysis.
Entry=0.2646-0.2786, SL=0.2253, TP1=0.3666, TP2=0.4176, TP3=0.5385. R/R=6.96
Good luck with your trading !

ROSE USDTwe see an ABCD pattern . in general , we expect correction to the range between 38.2 and 61.8 in case of failure.we can expect growth to the range of 78.6 CD.

ROSEUSDTWhile Roseusdt is experimenting with the cup handle pattern, it looks like he added another handle with bitcoin's correction. If he breaks this third attempt in volume, I wonder if he will continue on his way by folding as many as the last bowls formed respectively. Come on, let's watch together.

ROSE_USDTBy breaking the $ 0.27 upward range we can hold on to the next area, but the price will be in low support and buying in support will be very nice.

RoseDar surat soudi shodane bazar v tasbit dar navahie moshakhas shode,baste b close candel dar zaman kharid noghat amn kharid v hade sud moshakhas shode ast

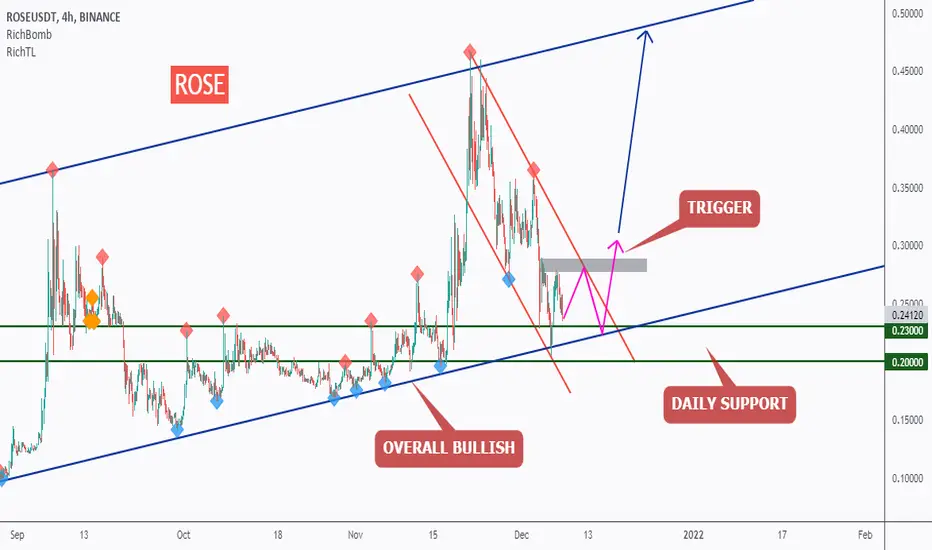
ROSE - Trend-Following Buy Setup!Hello everyone, if you like the idea, do not forget to support with a like and follow.
ROSE is overall bullish trading inside the blue channel. Since it is currently sitting around the lower blue trendline, we will be looking for buy setups on lower timeframes.
on H4: ROSE is forming a channel in red but the upper trendline is not valid yet, so we are waiting for a new swing high to form around it to consider it our trigger swing. (projection in purple)
Trigger => Waiting for that swing to form and then buy after a momentum candle close above it (gray zone)
Meanwhile, until the buy is activated, ROSE would be overall bearish from a short-term perspective and can still trade lower inside the green support before going up.
Good luck!
All Strategies Are Good; If Managed Properly!
~Rich
OASIS ROSE - Inverted Head and Shoulders forming?? $0.35??ROSE is setting up to form an Inverted Head and Shoulders pattern, which may play out if BTC looks positive. The technical price target for this pattern is $0.35.
If BTC begins to look bad, alts like ROSE will suffer, possibly sending ROSE to about $0.22 at the bottom of a potential symmetrical triangle.

big breakout inbound🍿Roseusdt looks like it wants to break this triangle pattern soon, if it does price targets will be 0.33335-0.39774-0.46213
on the daily time frame we can see its currently sitting on a very strong trend support and bouncing with bitcoin, great risk reward at these levels in my opinion.
goodluck! like and follow for more 💘

🔥 ROSE Inverse Head & ShouldersAfter hitting the $0.45 area around three weeks ago, ROSE has seen a very strong bearish correction, climaxing last weekend.
However, the last dip towards $0.2 caused a very strong bullish reversal. During this reversal, an inverse head & shoulders pattern has appeared on the chart. Inverse head & shoulders patterns are classically bullish patterns.
Targets placed at recent lows and highs.
Happy trading!

ROSEusdtThere are 2 markings. I like the blue one better. However, the yellow line is in favor of the fact that the movement may continue against the background of expectations of a reversal in the entire crypt, so it is better to look at the breaking of the blue line at the beginning.


ROSEUSDTHello Crypto Lovers,
Mars Signals team wishes you high profits.
We are in a 4-hour time frame.
As you can see, the price is moving towards its support line and is in a good range to buy, but take capital management seriously.
If supported, it can move towards its first resistance line, but if it drops and stabilizes below the first support line, it can move towards its second support line.
Warning: This is just a suggestion and we do not guarantee profits. We advise you analyze the chart before opening any position.
Wish you luck

🔥 ROSE Reversal AreaSince earlier this summer, ROSE has been trading in this ascending wedge pattern. In my last ROSE analysis, ROSE was trading at the top of the pattern, which ended up in a bearish move.
During the dump, ROSE failed to break through the support of the wedge, which could indicate a reversal in the short term. I'm waiting for a strong green candle to mark the bottom, ideally a BTC above 50k as well. Be aware that a bearish break out could lead to term bear trend for ROSE.
Target would be the top resistance of the wedge.
Happy trading!

I ❤️ ROSE - Trading Plan to new ATH This 4H close will be a critical!
My recent posts on ROSE have been following its price action closely, ROSE has withstood a big sell pressure the past 3 days holding above the 0.3 support and buyers are now regaining the upper hand and looking to close the 4H and the daily above the critical 0.32 level
If we close this 4H (which will also be the Daily) above 0.32 it will be very bullish. If ROSE can close near 0.33 it will also break above the 4H 50MA, which it has not been able to get above the past week, showing further confirmation to the upside
Trading Plan (updated from related idea):
Upside: we can see a global trend has now formed for this structure (which has now broken!). ROSE will need to break that trend (and has!) and the 0.32 resistance for the buyers to gain the upper hand (4H close will confirm!). I will be taking profits at the 0.35-0.36 neckline and adding on the pullback towards 0.32 and building my position further if we pierce through that neckline zone on the 4H retest. There is as the possibility of a descending channel resistance, but I think the trend and neckline are the primary points to watch. As soon as we break this neckline we will quickly markup towards the major neckline resistance of the weekly structure and towards a new ATH with this possible 260 day+ structure breakout (see related idea)
Obviously! if BTC tanks this will shift the dynamic as the market feels very flighty at the moment, and people will run for the doors. So this is my downside trading plan
Downside: If we break to the down side, I will be watching for a bounce first at the revisit to the 0.27, but the 0.23-0.21 is the optimal buy zone as this is the confluence of a high value area at 0.23 and the dynamic support ROSE has been following for the past couple of months. This is the zone I will be looking to really load up if we break down. Happy trading

ROSE - one of the most underrated crypto right nowROSE has the potential to be the top 30 coins. It has great technology (Paratimes, Lisp smart contract, separate chain for consensus), a great team, and big-name VCs. Right now it's definitely a good area to accumulate for a big run.

I am stocking up on ROSEUSDT, here's why.We have identified a strong ABCD pattern on BINANCE:ROSEUSDT , indicating a bullish trend in the short-term. However, I wouldn't rely on this pattern alone.
The stochastic RSI suggests that we are currently oversold, which checks out because we are indeed testing the support line in the middle of our current uptrend.
Additionally, the MACD tells us that bullish momentum is still standing strong. This in combination with the stochastic RSI being oversold tells me that we might see a run to the upside very soon, which would confirm the ABCD pattern.
What are your thoughts?

Close rose!!We close rose , because of its condition.....it has reach overbought we....buy it in better condition


ROSE - Possible Falling wedge bullish breakout, level to watchFor those watching ROSE, look for a bounce at 0.27 (previously marked area of interest, and 0.68 fib retrace) for a possible continuation to the upside with a break of this falling wedge formation. May be the opportunity to reload before it attempts another move up
Break to the low side will see a move toward 0.21-0.22 trend support
Detail about ROSES levels and movements in related idea
