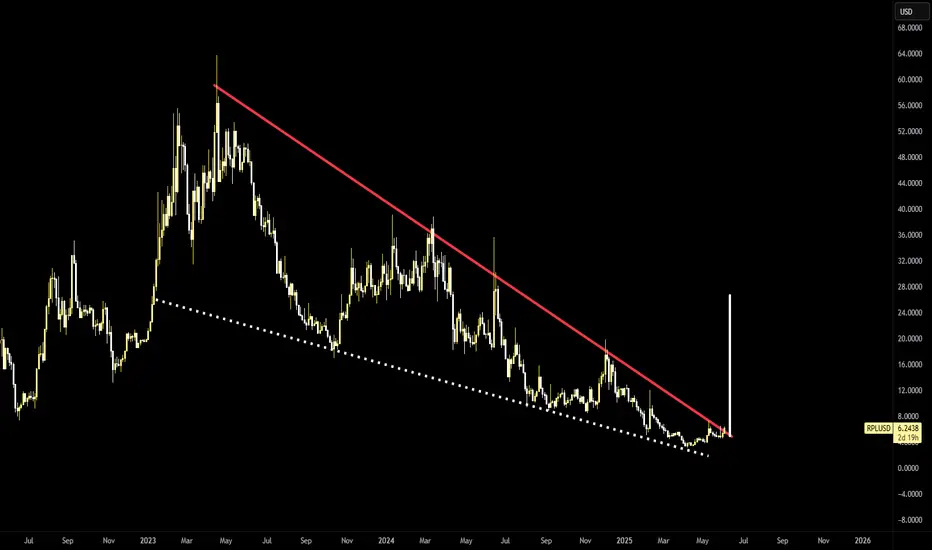
Rocket pool the signal for staking ETF approval?- a token, critical to the staking ecosystem
- in a giant falling wedge
- with Ethereum´s staking ETF pending, should it be approved by the SEC it is highly likely anything ETH related surges to the upside
RPLUSD trade ideas
Rocket upProbability Analysis Based on Technical Indicators:
1. Bullish Scenario (Rebound towards $16 or higher):
MACD: Signs of bullish crossover → 60% probability of continued upward movement.
Stochastic: Exiting oversold territory → 70% probability of upward momentum.
Bollinger Bands: Rebound from the lower band and approaching the midline → 50% probability.
Weighted Average for Bullish Scenario: 60% probability of reaching the $16 resistance level.
2. Bearish Scenario (Breakdown below $14):
If the price fails to break above the Bollinger midline and the MACD crossover is not confirmed → 40% probability of dropping to lower levels ($12).
Summary:
Bullish Scenario Probability: 60%.
Bearish Scenario Probability: 40%.

Rocket Pool - react, don't predict!Hello, traders!
This is my analysis on Rocket Pool (RPL).
Normally I use Binance as my main source for crypto charts, but I decided to use this chart instead for better historical data.
1️⃣ Analysis
In my previous post on Rocket Pool, I've suggested entering long after confirming the reversal and sell at 12.347. We now see the price rebounding as it touches the target price - allowing us new opportunities for opposite direction.
Looking at the historical data of the daily chart, we see that the price is on a constant downtrend. As marked in boxes, Rocket Pool has also shown multiple steady swing movements.
The price is now moving sideways just below the previous ATL of 13.70 - while it has shown rebound on July 8th, it eventually failed to maintain the uptrend, falling below the level.
2️⃣ Expectations
The current movements suggest that the price will start declining again. With price right under ATL, there's a possibility of price maintaining the swing movements longer.
However, we also cannot exclude a possibility of the price recording new ATL with further downtrend as it did last week on 5th. The price has already been in a downtrend for over 6 months and failing to completely rebound at ATL cannot be overlooked.
Red support line based on two LL points of August 5th(LL after the lower breakout) and November 5th (most recent LL) showing precise price actions two years back when extended to the left also support this expectation.
Another possibility to consider, though, is price breaking through the consolidation box upwards and starting an uptrend. This is very possible due to the current market condition in which many other cryptos led by BTC and DOGE are breaking through the resistance line.
3️⃣ Key approach
Our first strategy is to enter short after confirmation. Our initial target price would be 10.37, next being 9, and final being 8.41. We want to be extra cautious in this approach because we are trading against the overall market sentiments. This is why our initial target price is 10.37, to lock in the profit. Our next targets could be unrealistic due to the market condition.
4️⃣ Other approach
Our second strategy is to enter long. My second strategy is usually inferior to the first one, but this time, it's almost 50-50. But make sure to enter after solid confirmation - with price being below ATL and inside the consolidation box, we must see the breakouts first. Like any other breakouts, this contains uncertainties.
5️⃣ Considerations
We see the crypto market in its historical bull rally. With Trump winning the election and BTC reaching over 82k now, we don't know exactly when the rally would slow down - if it's ever going to in next few months. This could affect Rocket Pool to weaken or even seize its downtrend which is why we should approach cautiously to shorting.
Rocket Pool being under its ATL gives us a lot of uncertainties and variables, making us hard to decide. Granted, many other cryptos were also showing continuous downtrend before the election but ATL is a different story. Be very cautious.
React, don't predict! Stay disciplined and patient. Don't get greedy and be thankful.
God bless :)
2 Corinthians 12:10

(RPL) rocketpool "ICO"Early funding for rocket pool came in the form of ICO, crunchbase.com metrics.
Initial coin offerings give a chance for people to buy the token before it is available for public trade on markets. Less decentralized than if the token had made no sales before being pushed to market.

RPL Rocketpool Asc Tri back up 30% Bullish case,
RPL moves back up to 200EMA and meets asc tri target of 30%
not advice only for educational purposes only

RPL back to Demand ZoneRocket Pool is one of the largest Eth liquid staking platform. Billion in total value locked, but market cap still below 1 billion.
Currently back to the weekly support and the demand zone. If we see the volume we can see huge accumulation of RPL at this zone.
We can get a good risk to reward entry at this levels. It will be very interesting to see when it breaks the current accumulation zone towards upside.

RPL LongLast week RPL respected its weekly support and now is above monthly support.
Who ever got the entry near the support line will be having nice greens by now.
If it can stay above the monthly support we might see it continue its run with the Bitcoin.
Very exciting few weeks ahead.

RPL Spinning top Reversal Candle. Juicy Short 💯😎Not financial advice.
All trades are made on current market conditions.
If you can see the spinning top reversal candle setup here on the one day.
I have noted the stop loss as well as the take profit areas for a retest of the trendline.
Also of note we developed hidden bearish divergence on stoch RSI.
As price was rising STOCH Rsi didn't register the new high creating a hidden bearish divergence.
Also overbought on the Regular Rsi with a double top on Rsi.
All signs point to a reversal.
Always practice patience.
#PIK
#TLAW
Think Like A Whale
Let's see how it works out.

✴️ Rocket Pool Looks Different, Which Is Good!Let's look at Rocket Pool (RPLUSD) next which has an interesting chart to me because the pattern is different to others.
First, I see strength here which is always great as we are bullish currently on this market.
Believe it or not we have a bearish moment as well but this is only when prices are either dropping or set to drop, as in late 2021 or early 2022.
Let's zoom in on the RPLUSD chart:
This Doji here is important as it works as a reversal signal with the next candle being the confirmation. A strong green candle that closes above EMA10.
Now zoom out and that's the main chart above.
The initial 2023 wave went for ~390%, more or less (~) and you can see the strong higher lows, March and July.
So, we have the Doji in July while other projects bottomed by mid-June, this is different.
Even while this pair bottomed just two days ago the price remains really strong, meaning that the next high or long-term potential as a Crypto to hold value is really good, based on the chart technicals.
I see the positive and for a reason... The RSI bottomed and is below 50 but this is good even though it can be read as "weak" or "bearish".
Knowing the current situation of the market...
The MACD is below zero which can be considered bearish but showing a bullish cross.
The positive of these two is that there is actually plenty of room for growth.
Just as when you are at a new All-Time High, the chances are huge for a drop.
Once you hit bottom, the only way to go is up.
We have a strong price action, this pair holding strong.
The indicators have gone through a reset because soon we will experience growth.
Namaste.

RPLUSD - Middle Line as SupportThe middle line of this up channel has consistently been tested and consistently provided support
Likely that we will see a rebound upwards from here as we have come to see

RPLUSD Major break-out of Channel Up needs now the candle closeRocket Pool (RPLUSD) broke today above the Channel Up pattern it has been trading in since July 2022. That has happened another two times in that period but both 1D candles managed to close back inside the Channel Up.
As a result, if today's candle closes above it, we will translate it as a major buy signal, targeting the 80.000 All Time High. This is supported already by a 1D Golden Cross but more importantly by the 1D MACD which contrary to the previous Highs, it made a Bullish Cross straight after the Bearish Cross of its top.
-------------------------------------------------------------------------------
** Please LIKE 👍, FOLLOW ✅, SHARE 🙌 and COMMENT ✍ if you enjoy this idea! Also share your ideas and charts in the comments section below! **
-------------------------------------------------------------------------------
💸💸💸💸💸💸
👇 👇 👇 👇 👇 👇
