DAY14 #RSRUSDT (#LONG)DAY14 #RSRUSDT (#LONG)
More trading signals and their results, in my channel, link in the description
1% of the deposit
Margin: isolated
⚖️Leverage: x10-20
🗝Entry point: 0.007650-0.007700
🎯target 1 - 0.007841
🎯target 2 - 0.008005
🎯target 3 - 0.008161
🎯target 4 - 0.008334
🎯target 5 - 0.008605
❌stoploss: 0.007498
Pending order 1% = 0.007572
RSRUSDT trade ideas

✅TS ❕ RSRUSD: reached the support✅✅ RSR has reached the support level.
The price has already started to slow down.
I expect growth. ✅
🚀 BUY scenario: long to 0.0087.🚀
----------------------------------------------------------------------------
Remember, there is no place for luck in trading - only strategy!
Thanks for the likes and comments.

BABA ALWAYS RIGHT: RSR WILL GO TO 0.0104BABA ALWAYS RIGHT: RSR WILL GO TO MOON TO 0.0104 AFTER REACHING 0.076...DUE to project carrying... stable as of now...
buy buy buy buy...
not financial advice.....


RSRAfter reaching new highs since June, RSR has pulled back through its monthly open. I suspect there's a decent probability that this is a deviation beneath the monthly open; reclaim monthly and target that October swing high. Especially liking how bbands are shaping up.

RSR - Mainnet DumpPlayed out as expected in the previous post, hit resistance, tested support (.0088), not enough buy volume, so it broke below it
Current scenario with Main-net approaching in a few days, I believe it goes back up to .0088 with the final main-net hype then dumps back down to .0055 area

RSR.Usdt (Y22.P4.Video1). Mediam to Macro perspectiveHi All,
Looking at the bullish perspective with some targets.
We define the levels and explain why.
all the best,
S.SAri

RSR/USDT UpdateMainnet launch Oct 10. The price of Reserve Rights has risen by 11.23% in the past 7 days. TP: 0.011

RSR 4H resistance retestSmooth resistance retest, can go even higher. Not sure only because of BTC, as am waitin for it in a support zone 19400-19600.
+ It's still on a trendline
+ MA50 retest
+ Resistance retest
? BTC


BABA ALWAYS RIGHT: RSRUSDT WILL DOWN TO 0.007 OR LOWERBABA ALWAYS RIGHT: RSRUSDT will be down to 0.007 after getting to 0.00938.... overbought, very bearish.. indicative curve lower on future... technically weaker on curve....
sell sell sell sell....
not financial advice...

BABA ALWAYS RIGHT: RSRUSDT WILL DOWN TO 0.007 OR LOWERBABA ALWAYS RIGHT: RSRUSDT will be down to 0.007 or lower after going to 0.0095...overbought, unstability gained till now, no holding curve... too bearish...
sell sell sell...
not financial advice

#Trade 12 RSRPossibility movement SRS
Range Entry Price
- 0.009233
Profit Level On fibo
- SL 0.009113
High risk, Aware Sl hunt, Also SL can be Entry Price


Possible Bullish Divergence on 15minWill RSR bounce from here and go higher again? Still 7 days till network upgrade, too oversold too quick.

Retracement to 200 EMAThis one could have the momentum to pull back to 200 EMA, or further depending on broader macro action. Cautious prediction for now as everything else seems to be pumping, not financial advice :)

Retrace targets if this is the tops...Many are pumping RSR based on the upgrade on the 10th of October... remember what happened to ETH... Too much bullish sentiment, going to be a contrarian here... If this is the current tops for now, down we go again, this area was once support now turned to heave resistance.

RSR - 4H Bearish DivergenceRSR has shown incredible positive price action in the last days, skyrocketing from ~$0.005 to $0.01 in a matter of a week.
I was expecting a tiny correction from $0.008 area but instead price jumped ~20% up.
Higher highs on RSR price did not follow with the same pattern on RSI and MACD, making me believe that a small price correction vis-a-vis negative outlook on public markets, cyrptocurrencies in general and overall geopolitics.
Opened a short in area $0.0096, targeting $0.0092 and below. Trade cautiously as the token is experiencing positive traction and lot of speculation.


RSR analysis Let’s have a look at rising #RSR
RSR is the native token of the Reserve Protocol platform launched in 2019. The long-term goal of the protocol is to create a stable decentralized global currency, protected from inflation and at the same time not pegged to any fiat currency. The project uses RSR to secure the value of the Reserve stablecoin (RTokens) through staking. A basket of tokenized assets is used to back the currency.
As announced by the project team, the full deployment of the protocol and the launch of its main network will take place in October. Presumably this will happen on October 10th. This will enable the decentralized applications (dApps) platform, allowing the creation of RTokens.
As you can see, while waiting for the launch of the mainnet, RSR has shown an increase of 85% over the past 10 days which is a strong and aggressive growth and also we have come to the resistance zone with almost no corrections. For me, this means that this resistance will be broken sooner or later, but now I would expect a correction from this level and accumulation, perhaps we can break through this resistance earlier on the news background, but it seems to me that this breakdown may be false and after the news we will show a correction.
We see a very good accumulation and the coin is really very interesting, but the bear market

local top in $rsr i think we retrace abit , to fvg ,then continue up into mainnet , but for now am short ,

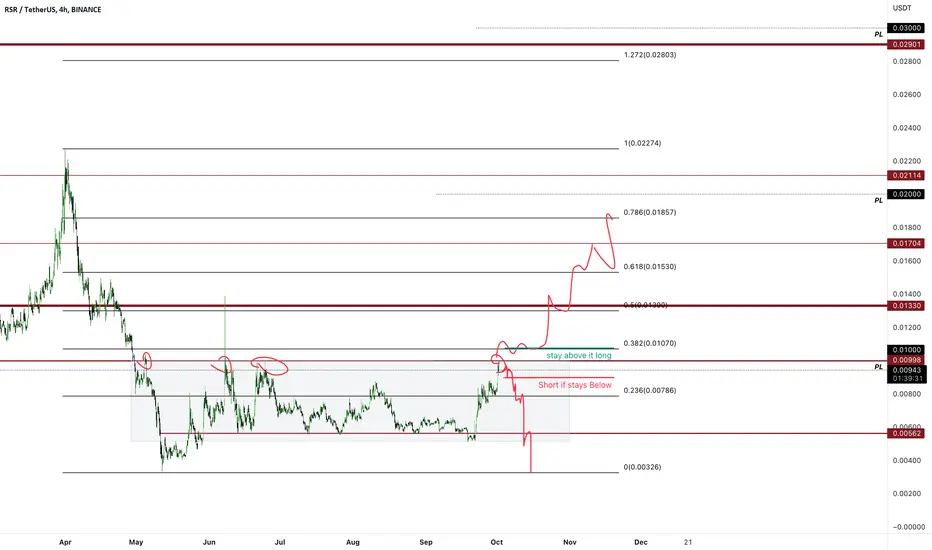
#RSR on key resistance. long if it flips .0105#RSR if stays above $.0105 then long to .013 , .015, .017 with extended target of .0185. if fails to stay above .009 , then short to .0785 and .005 as targets.