$BINANCE:RSRUSDT .1DBINANCE:RSRUSDT
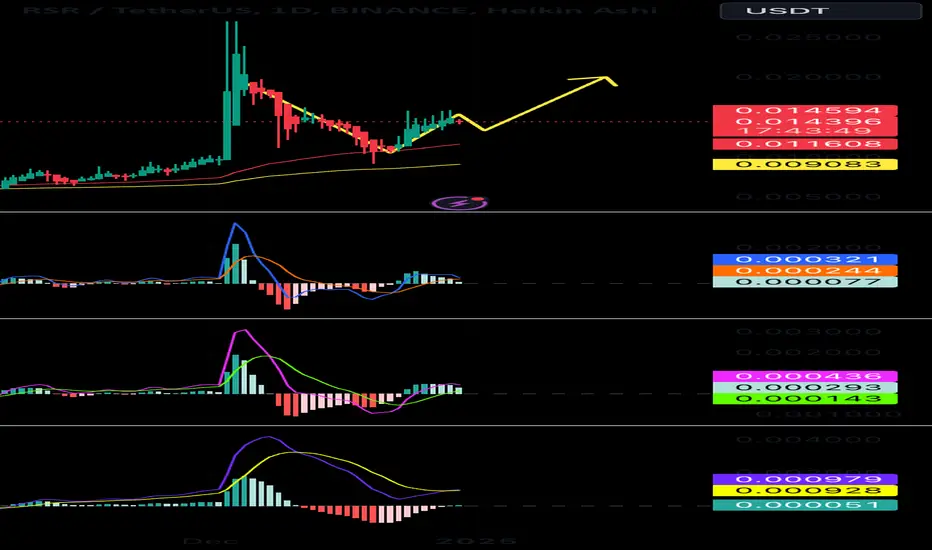
Staying away from this because the topping structure is seen.
Will wait until I see some positive intent.
RSRUSDT trade ideas


RSR move to local resistance zoneBINANCE:RSRUSDT
✅Before we start to discuss, I would be glad if you share your opinion on this post's comment section and hit the like button if you enjoyed it.
Thank you.
Now almost all alts charts looks the same! top, one and half year downtrend line and bottom around more or less -0.18 and -0.27 zone by fib!
Everything on chart is D1 Timeframe
Possible Targets
➡️We possible passed the bottom and now in accumulation phase
➡️ Red box is first resistance zone where we can reject and come back down around September.
➡️ Already broke with retest on D1 timeframe downtrend line. I think we will see more than 150 days in accumulation phase before real reversal move and new cycle.
➡️Minimal targets for next year is 0.5 level by FIB
Hope you enjoyed the content I created, You can support with your likes and comments this idea so more people can watch!
✅Disclaimer: Please be aware of the risks involved in trading. This idea was made for educational purposes only not for financial Investment Purposes.
* Look at my ideas about interesting altcoins in the related section down below ↓
* For more ideas please hit "Like" and "Follow"!

RSRUSDTWe can attempt to buy RSRUSDT from specified level as it makes HL , also 0.618 FIB level intact indicate that it moves upward.
SL , TP mention in chart.

RSR UptrendBlack 4 from my previous analysis seems to be complete.
Blue 1 should be wrapping up soon.
Blue 2 is a buying opportunity targeting recent highs.


$rsr short , short term I am currently short accoss all crypto we have hit resistance on many cryptos i think we retrace abit .
Current Resistance Zone: $0.01480 - $0.01528
Price is testing a strong resistance area
a premium
Bearish Confluence:
Liquidity Sweep: Price recently grabbed liquidity above prior highs near $0.01528, showing potential exhaustion.
Bearish Rejection: Multiple candle wicks near the resistance zone suggest rejection as sell orders dominate.
Sellside Liquidity: Below $0.01378, there’s untapped liquidity and an attractive target for short positions.
Bill Williams Insights:
Alligator Indicator: Moving averages are converging, signaling a potential reversal or consolidation phase before price direction continues.
Fractals: A bearish fractal is forming near resistance, adding to the likelihood of a short-term pullback.
Trade Idea
📉 Short Setup:
Entry: $0.01480 - $0.01528
Target 1: $0.01406 (38.2% Fibonacci level)
Target 2: $0.01378 (Key support & sellside liquidity)
Stop Loss: Above $0.01550
Trade wisely and manage your risk! 🙌
#ICT #RSRUSDT #CryptoTrading #BillWilliams

Rsr 4 Hour Chart Reversal Pattern In 1 Day Also .All the Fair Value Gaps (FVG) and support and resistance levels have been identified and are clearly mentioned. You are free to enter a trade at your convenience, based on the above analysis and strategy.
If you wish to ride the trend for a longer duration, you can choose to do so while monitoring market conditions closely. Alternatively, you may exit the trade whenever you feel it is appropriate to secure your profits or minimize losses.
Please trade carefully and ensure that you manage your risk effectively, considering the size and constraints of your portfolio.
Wishing you successful trades and a happy trading journey!

Double Top forming on 15 M timeframeObservations:
Double Top Formation: A bearish reversal pattern, indicating potential for price to move downward.
Resistance Level: Around $0.015047, marked in red.
Support Level: Around $0.014675, marked in green.
Downward Momentum: Price broke below the neckline (support level) of the double top.
Volume Confirmation: Increasing sell volume after the double-top pattern.
Momentum Indicator: The histogram (MS) shows declining strength, aligning with the bearish momentum.
Short Trade Setup:
Entry Point: Enter a short trade after price retests the support level as resistance around $0.014675, confirming the breakout.
Take Profit (TP): TP1: $0.014350 (previous key level of support).
Stop Loss (SL): Place the SL above the neckline of the double top at $0.014750 (slightly above to account for false breakouts).
Risk-Reward Ratio:
Entry: $0.014675
SL: $0.014750 (7.5 pips above entry).
TP1: $0.014350 (32.5 pips below entry).
Risk/Reward for TP1: 1:3.43

Prepare to BUY Spot RSRUSDT for a Mid-Term Investment (Weekly)Prepare to BUY Spot RSRUSDT for a Mid-Term Investment (Weekly Chart)
🌟 Leverage Mid-Term Opportunities with RSRUSDT! 🌟
🌍 Market Overview:
RSRUSDT is showing strong potential on the weekly chart, making it an excellent opportunity for mid-term investors targeting significant returns.
📊 Trade Plan:
📌 Entry Point: Around $0.133 – Strategic accumulation for an optimal position.
🎯 Target: x2 – Doubling your investment by leveraging mid-term market trends.
⏳ Hold Time: Up to 3 weeks – Follow the mid-term cash flow strategy for controlled gains.
🔍 Strategy Insights:
Mid-Term Cash Flow Strategy:
Designed for stable returns over 2-3 weeks.
Focus on aligning with the broader market trend on the weekly chart.
Volume and technical indicators confirm strong potential for significant growth within the specified timeframe.
🚀 Next Steps:
💬 Contact me for personalized guidance or deeper insights into the strategy.
💡 Note: This is not financial advice. Always DYOR before trading.
🔥 RSRUSDT is primed for a mid-term breakout – Position yourself now! 🔥
RSR/USDTKey Level Zone : 0.01300-0.01320
HMT v3.1 detected. The setup looks promising, supported by a previous upward/downward trend with increasing volume and momentum, presenting an excellent reward-to-risk opportunity.
HMT (High Momentum Trending):
HMT is based on trend, momentum, volume, and market structure across multiple timeframes. It highlights setups with strong potential for upward movement and higher rewards.
Whenever I spot a signal for my own trading, I’ll share it. Please note that conducting a comprehensive analysis on a single timeframe chart can be quite challenging and sometimes confusing. I appreciate your understanding of the effort involved.
If you find this signal/analysis meaningful, kindly like and share it.
Thank you for your support~
Sharing this with love!
HMT v2.0:
- Major update to the Momentum indicator
- Reduced false signals from inaccurate momentum detection
- New screener with improved accuracy and fewer signals
HMT v3.0:
- Added liquidity factor to enhance trend continuation
- Improved potential for momentum-based plays
- Increased winning probability by reducing entries during peaks
HMT v3.1:
- Enhanced entry confirmation for improved reward-to-risk ratios

#RSRUSDT ( inv. h & s ? ) In this view of the chart,
we see the formation of a beautiful bullish inverted head and shoulders pattern,
which
can rise to the pattern's targets by maintaining the green neckline.

Bullish RSR/USDT 4-Hour Inverse Head and Shoulders AnalysisI’m looking at the RSR/USDT 4-hour chart and noticed an Inverse Head and Shoulders pattern forming. First, there’s a clear left shoulder, followed by a deeper drop that created the head at the lowest point. After that, I can see the right shoulder shaping up, suggesting a possible bullish reversal could be on the horizon.
The key level I’m watching is the neckline, which is basically the horizontal resistance line connecting the tops of both shoulders. If the price breaks above this neckline on higher-than-usual trading volume, I’ll consider that a strong confirmation of the pattern and look for an upward move. My target for this move is around the 0.023–0.024 range (roughly a 60% gain from the breakout point), based on the classic Head and Shoulders measurement technique.
For risk management, I plan to use a relatively tight stop-loss just below the right shoulder level. This way, if the price fails to hold above the neckline and turns downward, I’ll be protected from a major loss. With this setup, the risk/reward ratio is quite attractive—over 12 to 1 in my estimation.
Of course, I’ll be watching overall market conditions as well, since larger market trends (like Bitcoin’s performance) can influence altcoins. None of this is financial advice, and I always recommend doing your own research and considering your risk tolerance before trading.

RSR bullish flagHype pumped rsr pretty early giving him time for consolidation.
Reversal from consoludation already happen.
Major consolidation levels broken forming an bull flag
Trade entered at 0.0136 looking for break out
tp is already up to 0.014 making 3% profit secured (leverage is X5)
i see 3 scenario
1 Breaking flag with early impusle (action : move tp up a little below the broken flag resistance)
2 Small retracement inside flag to get another impulse (action : no action, can trigger tp and close trade)
3 back to bottom of the flag, tp triggered and profit taken (action : Looks for another long opportunity if we dont break the flag )

RSRUSDT Analysis: Red Box Seller ZoneIn RSRUSDT, the red box indicates a zone with active sellers . This level is critical for observing potential resistance or reversals. Caution is advised when approaching this area.
Key Points:
Seller Zone: The red box marks a strong area where sellers are active.
Risk Management: Avoid premature entries; wait for confirmation signals.
Confirmation Indicators: I will use CDV, liquidity heatmaps, volume profiles, volume footprints, and market structure analysis to assess the strength of this level.
Learn With Me: If you want to master how to use CDV, liquidity heatmaps, volume profiles, and volume footprints to identify precise zones, just DM me. I’d be happy to guide you!
Reminder: Patience and confirmation are key in such conditions. Successful trading relies on understanding market dynamics and taking calculated risks.
If you think this analysis helps you, please don't forget to boost and comment on this. These motivate me to share more insights with you! Wishing everyone success in their trades.
If you think this analysis helps you, please don't forget to boost and comment on this. These motivate me to share more insights with you!
I keep my charts clean and simple because I believe clarity leads to better decisions.
My approach is built on years of experience and a solid track record. I don’t claim to know it all, but I’m confident in my ability to spot high-probability setups.
If you would like to learn how to use the heatmap, cumulative volume delta and volume footprint techniques that I use below to determine very accurate demand regions, you can send me a private message. I help anyone who wants it completely free of charge.
My Previous Analysis
🎯 ZENUSDT.P: Patience & Profitability | %230 Reaction from the Sniper Entry
🐶 DOGEUSDT.P: Next Move
🎨 RENDERUSDT.P: Opportunity of the Month
💎 ETHUSDT.P: Where to Retrace
🟢 BNBUSDT.P: Potential Surge
📊 BTC Dominance: Reaction Zone
🌊 WAVESUSDT.P: Demand Zone Potential
🟣 UNIUSDT.P: Long-Term Trade
🔵 XRPUSDT.P: Entry Zones
🔗 LINKUSDT.P: Follow The River
📈 BTCUSDT.P: Two Key Demand Zones
🟩 POLUSDT: Bullish Momentum
🌟 PENDLEUSDT.P: Where Opportunity Meets Precision
🔥 BTCUSDT.P: Liquidation of Highly Leveraged Longs
🌊 SOLUSDT.P: SOL's Dip - Your Opportunity
🐸 1000PEPEUSDT.P: Prime Bounce Zone Unlocked
🚀 ETHUSDT.P: Set to Explode - Don't Miss This Game Changer
🤖 IQUSDT: Smart Plan
⚡️ PONDUSDT: A Trade Not Taken Is Better Than a Losing One
💼 STMXUSDT: 2 Buying Areas
🐢 TURBOUSDT: Buy Zones and Buyer Presence
🌍 ICPUSDT.P: Massive Upside Potential | Check the Trade Update For Seeing Results
🟠 IDEXUSDT: Spot Buy Area | %26 Profit if You Trade with MSB
📌 USUALUSDT: Buyers Are Active + %70 Profit in Total
🌟 FORTHUSDT: Sniper Entry +%26 Reaction
🐳 QKCUSDT: Sniper Entry +%57 Reaction
📊 BTC.D: Retest of Key Area Highly Likely
I stopped adding to the list because it's kinda tiring to add 5-10 charts in every move but you can check my profile and see that it goes on..

RSR - LONG scenario very visible accumulation, the success rate of reaching the takeprofit is very high, I am personally buying.

RSRUSDT 1WRSR ~ 1W
#RSR Still in a bullish trend so far. If you still have Conviction on the coin,. Buy in stages from here. with a minimum target of 15%+

rsr/usdt bullish outlookI’ve identified an MSS (Market Structure Shift) on the 4-hour timeframe, signaling a potential shift in momentum from bearish to bullish. Let’s break this down:
1️⃣ MSS Breakdown
Bearish Structure Break: Recent price action showed a clear BOS (Break of Structure) to the downside, leading to liquidity grabs.
Bullish Market Structure Shift: Price has begun reclaiming previous significant lows, indicating a potential accumulation phase by smart money.
The MSS is a key sign of a reversal, especially when combined with confluence from higher timeframes and support levels.
2️⃣ Entry Model
Here’s the entry methodology I’m using:
Order Block Identification: I’ve identified a key bullish order block (OB) as the zone where smart money likely stepped in to accumulate positions. This OB serves as my primary entry point.
Premium/Discount Zones: Using the Fibonacci retracement, I confirm that the entry aligns within the discount zone (below 50%), ensuring optimal risk-reward.
Confirmation Entry: I wait for a smaller timeframe BOS or bullish reaction near the OB to refine my entry.
Trade Details
Entry Zone: Near the OB, which aligns with ~$0.0112.
Stops: Below the OB low, protecting against invalidation.
Targets: Multiple take-profit levels (TP1 through TP5), with the ultimate target near $0.026

rsr building momentum - just recording my guessjust for my own use to record my guess.
btc probably will dial down and as usual sunday will be the best day to buy at low price .
rsi reset from last week pump.
flag in play .
double bottom potential buy place.
rsi cross over probably monday /tuesday with incoming money flow

FTX Can Explode Higher In January MartyBoots here , I have been trading for 17 years and sharing my thoughts on FTX here.
FTX is looking beautiful , very strong base for more upside
Very similar to RSR which is up nearly 170% increase in a similar base
Do not miss out on FTX as this is a great opportunity
Watch video for more details


RSRUSDT: Prime Demand Zone on Lower Time FrameThe blue box marks the strongest demand zone on the lower time frame for RSRUSDT. This level is ideal for potential buy entries, as it represents an area where buyers are likely to step in aggressively.
Watch for price reactions within this zone and consider lower time frame confirmations for optimal entries. Always manage risk effectively.
I keep my charts clean and simple because I believe clarity leads to better decisions.
My approach is built on years of experience and a solid track record. I don’t claim to know it all, but I’m confident in my ability to spot high-probability setups.
My Previous Analysis
🐶 DOGEUSDT.P: Next Move
🎨 RENDERUSDT.P: Opportunity of the Month
💎 ETHUSDT.P: Where to Retrace
🟢 BNBUSDT.P: Potential Surge
📊 BTC Dominance: Reaction Zone
🌊 WAVESUSDT.P: Demand Zone Potential
🟣 UNIUSDT.P: Long-Term Trade
🔵 XRPUSDT.P: Entry Zones
🔗 LINKUSDT.P: Follow The River
📈 BTCUSDT.P: Two Key Demand Zones
🟩 POLUSDT: Bullish Momentum
🌟 PENDLEUSDT: Where Opportunity Meets Precision
🔥 BTCUSDT.P: Liquidation of Highly Leveraged Longs
🌊 SOLUSDT.P: SOL's Dip - Your Opportunity
🐸 1000PEPEUSDT.P: Prime Bounce Zone Unlocked
🚀 ETHUSDT.P: Set to Explode - Don't Miss This Game Changer
🤖 IQUSDT: Smart Plan
⚡️ PONDUSDT: A Trade Not Taken Is Better Than a Losing One
💼 STMXUSDT: 2 Buying Areas
🐢 TURBOUSDT: Buy Zones and Buyer Presence

#RSR/USDT bounced back from 4H FVG in 4-Hour TF!#RSR/USDT bounced back from 4H FVG in 4-Hour TF!
Waiting for this OTE to be tapped to long #RSRUSDT. The local support level is PMH $0.01.
