Reserve Rights Update #RSR $RSR (Jul-6)RSR is really dangerous at the $0.007 zone with the return of strong selling. RSR is only really safe if it is above the $0.008 zone. If there is no buying force to return, in the near future RSR will fall to the $0.006 zone to retest this zone, the possibility of holding this zone is very low and the probability is high that it will continue to fall to the $0.004 zone to retest the zone. this.
Accumulating RSR must be really careful because it can completely fall to the area of $0.002
RSRUSDT trade ideas

rsrthis could be a BIIG swing trade
need to see more comfirmation for a sniper entry
will update lately

RSRUSDTPERPThe upward trend line is lost and the selling pressure in the market is very high and the probability of this currency falling is very high

RSRUSDTHello Crypto Lovers,
Mars Signals team wishes you high profits.
This is a 4-hour-time frame analysis for RSRUSDT
According to our last analysis on June 21, we predicted a falling trend and in the current chart, this has come true and all our targets are hit. At the present, we have R1 as our resistance area. S1 and S2 are our support areas and they express the support of the price at several points. Here, the price is fluctuating over S1 and we expect a fall for it to S1 and again by a pull back, it will move gradually upward to R1. Those with high risks in trades are suggested to activate their stop loss and then start trading. But those who are not seeking high risks, we suggest them to wait for the price to reach S1 and the we consider a short position there and it might be a good point to trade. In case the price is able to fix over R1, more rise is waiting for it. But it is possible for the price to have more decline when it falls below S1.
Warning: This is just a suggestion and we do not guarantee profits. We advise you to analyze the chart before opening any positions.
Wish you luck

RSRUSDTPERPThe upward trend line has lost its position and is ready to fall, and due to the lower difficulties that have formed, the upward trend is expected to change to a downward trend.

RSR Going to 0.010BINANCE:RSRUSDT
RSR is making smetrical triangle in 4h tf, a break above will lead it to 0.010.

short to mid term RSR prediction ! Bullish version 50% +plus.Price heavily rejected from 0.009 area mainly due to BTC's weak stance and most importantly price action showed that we have huge buy pressure around 0.0075-0.008 zone. I drew multiple triangles to figure out most desirable possible price action. If Btc doesn't fail the whole market, there should be an attempt to 0.01 zone once more. I don't anticipate breaking upper end of of triangle right away but nobody can be sure. More likely we will try 0.010 and fail then check back to 0.007-0.008 level then hit 0.012+ range. If Btc fails, $0.0075 level should hold otherwise 0.0062-0.0065 will have to be the last stronghold! Anything under chart can not help us and not a good place to stay in the trade. Will be mostly random price action up and down.

RSRUSDT Buy tradeHello traders!
Welcome back to another episode with Analyst Aadil1000x.
Today we are buying RSRusdt, it's oversold and I am expecting a rise From the true reversal point.
0.00685 is a 5-star bullish True reversal point means this level can push the price 4-5 times from this level without letting it break hard.
RSR Buy limit 0.00689
Target 0.00765(+10.9%)
Stoploss 0.00658(-4.5%)
Risk management tip,
Use 10% of account max with 10x leverage.

Reserve RightsRSR/USDT now one more time i take LONG position because this coin take our 1H Demand Zone and waiting for TP 0.00820

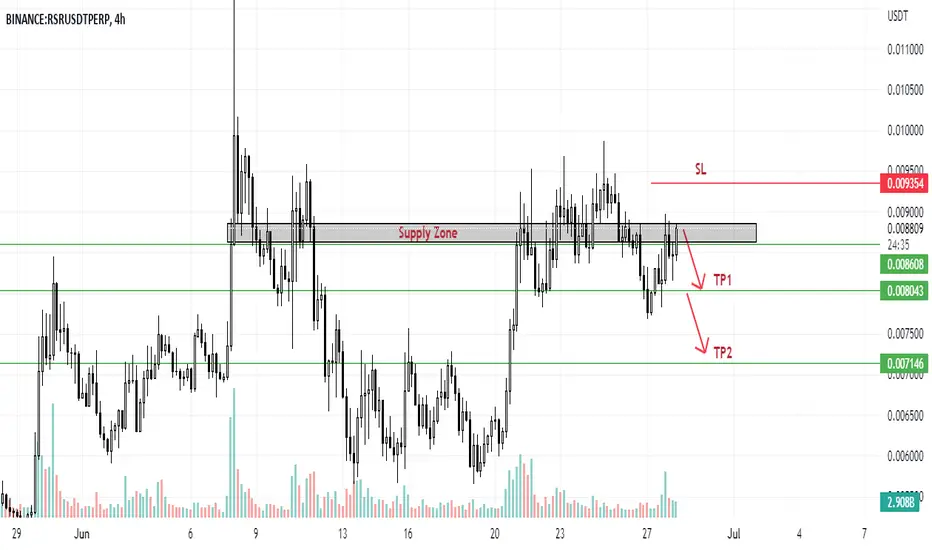
RSRUSDT | BEARS ATTACKRSR once again testing the supply zone level. bears have predominantly been strong at this point previously so we may see a pull back towards support levels again considering the bearish market sentiments as well. Stay Short with protection above for the said targets.
Risk your trade accordingly.

rsr long ...trend cather turning green on all time frame up to 45 min with rsi coming out of oversold . bullish div on the 30 min and trend catcher about to turn green also on the 1h with a buy signal pending. macd showing reversal on 1 h also.
cheers

rsr confirm buy signal part 3Already extended the take profit x for short for the last sell signal. macd turning will hopefully bring us down a bit to retest trama (part 1) and trend catcher(part 2).
volatility index is increasing and with have plenty of room to reach next resistance before hitting reversal zone.
cheers

rsr confirm buy signal part 2trend catcher turning green helps confirm lux algo' buy signal, yellow line oscilator ( rsi with 30 lenght without ursi) about to cross 50 (which would be my buy in) i would like to see a retest of the trend tracer green line. trade safe. cheers
alway keep an eye on btc as thing can change quick if it decided lol

rsr confirm buy signal part 1oscilator flashed green above TRAMA (white line) , which gives me a confirmation of lux algo buy signal. looking at a retest of the white line (trama) to buy in for a quick scalp. part#2 will show other confirmation signals i used to make this assesment.
cheers

RSRUSDT is testing the 4h resistanceThe price had a nice breakout from the dynamic resistance with volumes and now it's testing the 4h static resistance.
As you can see, this area is important for the market.
How to approach it?
IF the price is going to have another breakout we could see a retest of the daily resistance on 0.01, so According to Plancton's strategy, we can set a nice order
–––––
Keep in mind.
🟣 Purple structure -> Monthly structure.
🔴 Red structure -> Weekly structure.
🔵 Blue structure -> Daily structure.
🟡 Yellow structure -> 4h structure.
–––––
Follow the Shrimp 🦐

RSRUSDT🔥Subscribe to the channel to receive more new information about the cryptocurrency market✅
Hello👋
On the chart, the formation of a bullish triangle with its development.
I expect that the price will hit the local resistance zone, the field of which we will be able to see an immediate fall to the beginning of the pattern.

shorting retest of broken necklineplacing orders just under that horizontal red line and other some a bit higher up closer to neckline

does anyone actually believe in head and shoulders?5 minute chart clearly shows a head an shoulders. On the other hand, look at the fractals circled. Will it pump to new highs?

RSR nice scalp setupHey, spotted this nice RSR setup - two entries and 5 targets (lines on the chart). Lets see...

RSR / USDT Bullish TrendRSR /USDT Bullish Trend , I think this is vey good and see bullish and strong. Take Long position here .Must stop lose on last HL

#RSRUSDT SHORT15M trendline has been broken. Price will be decreased to the trendline of the bigger time frame.

finding a base near old weekly levelsin retrospect, helps to look back in time to find where to place bids
