Rsr looking for another daily %100 moveRsr tried to catch up xrp hbar and cardano and now consolidating for another crazy leg up. Let’s wait and see
RSRUSDT trade ideas

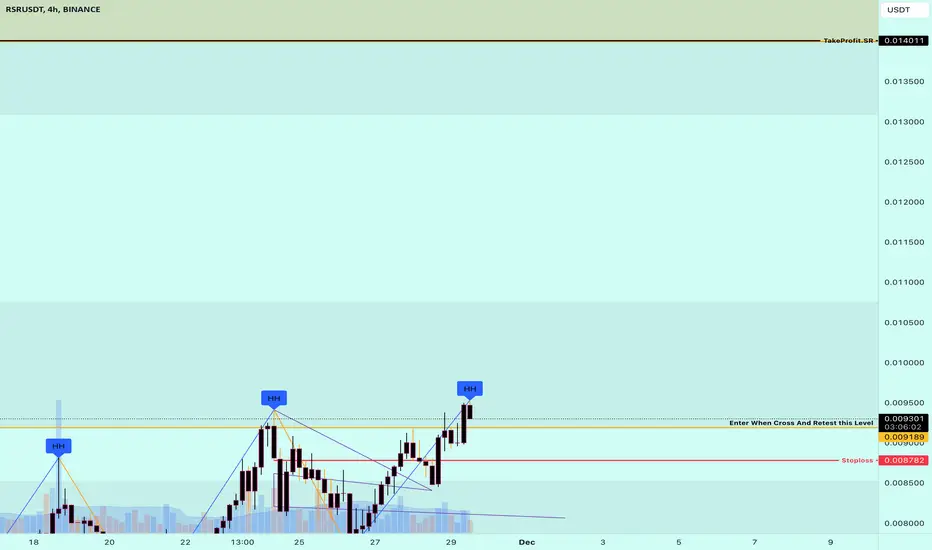
good long setup for rsr usdt 0.5 percent of portfolio
Not financial advise
Do your own research
best of luck
...........................................................................................................
Please follow and boost

Rsr aiming for something magicXrp Hbar and many similar ones pumped hard. For Rsr hold the box down can expect move to my target up. I have a swing position

Today's Investment Choice: RSRUSDTRSRUSDT: A Strong Buy Across All Timeframes
RSRUSDT presents a robust bullish structure when analyzing across D1, W, and M timeframes.
The Rainbow Indicator confirms a BUY signal on D1, W, and M frames, showing a strong consensus for RSR across multiple levels, from D1 up to 3M.
With this solid foundation, we take advantage of H4's downward correction to enter a spot BUY position.
Trading Plan:
Buy Structure: D1-W-M (strong bullish alignment)
Entry Price: Around $0.0224
Holding Period: Suitable for both short and medium-term strategies
Capitalize on the market momentum and ride the trend with confidence! 🚀

RSR touched a major order block support. Expect Price Growth!RSR just touched a reliable, long standing major order block support at 0.0028 levels based on daily data.
Expect some significant price growth from here on -- as net buyers have started positioning.
A notable volume increase has been registered this past 24 hours.
SEEDED L at 0.00280
TAYOR
safeguard capital always.

RSRUSDT (ReserveRights) Updated till 03-12-24RSRUSDT (ReserveRights) Daily timeframe range. PA moving like a absolute beast here. with high amounts of volume a valid close above 0.021359 can push it to 0.032296 or above. a little correction will be healthy here. local support at 0.009868.

Reserve Rights (RSR)Reserve Rights (RSR) is an ERC-20 token that serves two main purposes for the Reserve protocol: over-collateralization of Reserve stablecoins (RTokens) through staking and governing them through proposing and voting on changes to their configuration.
Anyway, the RSR chart is simple: an upward phase followed by a deep correction phase. The correction unfolded in a descending triangle. Then, RSR broke the downtrend line and went up, made a minor correction, and continued the upward wave. It seems RSR is aiming to reach the ATH or even go higher. Let's see what happens.

RSR looks super bullish (1D)It looks like wave B is over, which was a triangle. By maintaining the green range, it can move up to the red box.
The price has entered a bullish wave C.
Closing a daily candle below the invalidation level will violate this analysis
For risk management, please don't forget stop loss and capital management
Comment if you have any questions
Thank You

Reserve Rights (RSR) ResearchThe Reserve protocol is an innovative platform on Ethereum that, for the first time, enables the creation of asset-backed and over-collateralized stablecoins without the need for permissions. Reserve's primary mission is to introduce scalable, decentralized forms of stable currency designed to reduce the volatility common to cryptocurrencies like Bitcoin and Etherium.
The Reserve protocol empowers anyone to generate stablecoins, which are secured by collections of ERC-20 tokens across Ethereum, Base, and Arbitrum. These digital currencies, underpinned by stable assets within the Reserve framework, are dubbed "RTokens". After setting up an RToken, users can produce these tokens by contributing the full set of backing collateral tokens, and similarly, they can retrieve this entire set upon redemption. Consequently, the trading value of an RToken closely aligns with the aggregate market value of its backing basket, with discrepancies inviting arbitrage opportunities. RTokens boast an overcollateralization feature, ensuring that in the event of a collateral token failure, there's a reserve of value to offset the deficit. This extra security layer comes from holders of Reserve Rights (RSR), who have the option to stake their RSR on any RToken. Should a collateral token falter, the staked RSR can be automatically claimed through a system driven purely by blockchain-based price oracles, devoid of any need for governance decisions or human intervention.
Long-term goals of the project
Examining the lineage of currency shows us that as one dominant global empire cedes to another, the currency of the former inevitably declines. Historical examples include the Dutch Guilder and the British Pound, and now, according to Ray Dalio, the U.S. dollar might not retain its status as the global reserve currency forever.
Bloomberg has highlighted concerns, echoed by figures like Larry Fink of BlackRock, that burgeoning U.S. fiscal deficits might alienate significant foreign investors. This scenario could lead to a potential 30 percent drop in the dollar's value, as the Federal Reserve might find itself compelled to finance the national debt through monetization.
In response to this, the Reserve community is motivated to craft a stablecoin, known as an RToken, which aims to decouple from the U.S. Dollar's peg. The ultimate ambition for cryptocurrencies is not merely to mirror the stability of existing assets in the short term but to innovate a financial instrument that maintains stability in the immediate and exhibits superior stability over extended periods.
Investors
The RSR (Reserve Rights Token) project has attracted attention and investment from a number of prominent cryptocurrency and venture capital market participants.
Coinbase Ventures
GSR (MM)
Arrington Capital
Shima Capital
NGC Ventures
Fenbushi Capital
Digital Currency Group (DCG)
BlockTower Capital
Distributed Global
Chapter One
PreAngel (China)
Sam Altman
Peter Thiel
These investors are investing in RSR believing in the project's potential to improve the stability and availability of cryptocurrencies, especially in regions with unstable economies. The participation of such significant names indicates the high interest in the project in investment circles.
Staking
Reserve Rights (RSR) serves as an over-collateralization mechanism to protect RToken holders in the rare event of a collateral token default. To enable RSR holders to provide this over-collateralization, they have the option to stake their tokens on any single RToken or distribute their RSR across multiple RTokens. Additionally, RSR holders can choose not to stake their tokens at all.
In exchange for providing this over-collateralization, RSR stakers can expect to earn a share of the revenue from the specific RToken they stake on. Generally, the greater the market cap of the RToken they stake on, the more revenue RSR stakers will receive.
When RSR is staked on an RToken, the tokens are deposited into a staking contract specific to that RToken, and the staker receives a corresponding ERC-20 token, which represents their staked RSR position on that particular RToken. This token is transferable and fungible with other staked RSR for the same RToken, allowing you to send any portion of the staked position to someone else or trade it, and the new holder has the option to unstake it if they choose to.
Understanding RSR Staking Rewards and Mechanics:
Rewards Calculation: Your rewards from staking RSR tokens are influenced by how much revenue the RToken generates, the percentage of this revenue allocated to RSR stakers by governance, and your share of the total staked RSR. For example, if an RToken earns $100, 20% is set aside for stakers, and you've staked 10% of all RSR staked on this RToken, you'd receive $2 as your reward for that period.
Mechanism of Reward Distribution: Rewards are not directly paid out but are used to buy back RSR through market auctions, increasing the value of staked RSR relative to unstaked RSR over time.
Staking Risks and Unstaking Delays: When you stake RSR, your tokens are at risk of being used to cover losses if there's a default in the collateral tokens backing an RToken. Unstaking isn't immediate; there's a delay (typically set between 7 to 30 days by governance) to ensure enough RSR remains staked to cover potential defaults. During this unstaking period, you won't earn rewards, but you can cancel the unstaking process to continue staking.
Accessing Staking: The simplest method to stake RSR is through platforms like Reserve Register, which provide user interfaces to interact with the smart contracts of the Reserve Protocol.
This system not only incentivizes staking by offering rewards but also secures the protocol by using staked RSR as a first line of defense against collateral defaults, ensuring the stability and integrity of RTokens.
Tokenomics
The Reserve Rights (RSR) token has a capped supply at 100 billion. As of now, 50.6 billion RSR are circulating, with the remaining 49.4 billion held within the Slow and Slower Wallets.
Slow Wallet: This wallet, managed by the Reserve project team, is designated for funding initiatives that drive RToken adoption. Any withdrawal from this wallet requires a compulsory 4-week waiting period after the transaction is initiated on the blockchain.
Organizational Shift in 2024: The governance of the funding for the Reserve Ecosystem underwent changes, introducing Confusion Capital. This entity oversees financial support for projects within the ecosystem like Best Friend Finance and ABC Labs, which concentrates on the development of the core protocol.
Slower Wallet: Under the administration of Confusion Capital, this wallet inherits its funds from the Slow Wallet but introduces stricter withdrawal rules. Besides maintaining the initial 4-week delay, it limits withdrawals to no more than 1% of RSR's total supply over any 4-week period. This adjustment aims to minimize the level of trust required in Confusion Capital. Here’s how the withdrawal throttle works:
After a period of no activity, the withdrawal cap could reach its maximum of 1 billion RSR.
Upon initiating a withdrawal of 1 billion RSR, the cap drops to zero.
After 2 weeks, the cap replenishes to 500 million RSR, allowing for a new withdrawal of up to 250 million RSR, reducing the cap back to 250 million RSR.
One week later, the cap increases again to potentially 500 million RSR, depending on previous activities.
This structured approach ensures a gradual release of funds, reinforcing trust and stability within the ecosystem's financial operations.
Blockchain
GSR Marketmaker activity has been spotted and is beginning to gear up for the alt season and pump up the asset. Be ready for a rapid growth of RSR in the near future!
Below are a couple of wallets owned by investment funds. As you can see, they continue to hold RSR after unlocks, which indicates that there was no distribution and we should prepare for pumping, which will trigger liquidity. This way large investment funds will be able to start selling their assets due to “born liquidity”.
It is also worth noting that most of the issuance is in the hands of those who benefit from growth! It can be seen that SlowerWallet and team have >50% of all tokens, followed by exchanges. After exchanges, the obvious leader is investment funds, which I wrote about a bit above.
Conclusion
Reserve Rights and the RSR token are on the cusp of significant change, with the potential for exponential growth. Given its innovative approach to currency stabilization, growing community, expansion into new markets and positive technical analyses, the project is well positioned to strengthen its position in the cryptocurrency ecosystem. The fundamental aspects of Reserve Rights offer an optimistic outlook on its future, making RSR interesting for long-term oriented investors.
Best wishes, Horban Brothers!


#RSR/USDT#RSR
The price is moving within a bearish channel pattern on the 4-hour frame, which is a strong retracement pattern
We have a bounce from a major support area in green at 0.004746
We have a tendency to stabilize above the Moving Average 100
We have a downtrend on the RSI indicator that supports the rise and gives greater momentum, upon which the price is based higher at the discount
Entry price is 0.004746
The first target is 0.006078
The second target is 0.06985
The third goal is 0.008128

RSRUSDT Cup and Handle Pattern!RSRUSDT Technical analysis update
RSRUSDT price formed a cup and handle pattern at the bottom. The price broke the cup and handle pattern's neckline resistance on the weekly chart, took around 900+ days for the breakout. If the price remains above the neckline in the weekly candle close, we can expect a bullish move in the coming days.

#RSR: Unlocking Stablecoin Utility and AdoptionDescription:
This trading idea centers on RSR (Reserve Rights), a cryptocurrency designed to support the Reserve Protocol’s mission of creating a stable and inflation-resistant global currency. RSR plays a vital role in stabilizing the value of the protocol's stablecoin, RSV, by acting as a reserve asset and governance token. As demand for decentralized and reliable stablecoins grows, particularly in regions with economic instability, RSR benefits from increasing adoption and utility within the ecosystem. Its dual-purpose design, focusing on stability and governance, positions RSR as a key player in the future of decentralized finance (DeFi).
It’s important to recognize that the cryptocurrency market remains volatile, with external factors such as regulatory developments, market sentiment, and macroeconomic conditions impacting price movements. Trading RSR or any digital asset requires careful risk assessment and strategic planning.
Disclaimer:
This trading idea is for educational purposes only and does not constitute financial advice. Investing in cryptocurrencies like RSR involves significant risks, including the potential for a total loss of capital. Always perform thorough research, evaluate your financial position, and consult with a professional financial advisor before making investment decisions. Past performance is not indicative of future results.
rsrusdtrsr looking good for this bull run, top of the channel possible but would take profits along the way. Wave 3 its at 1.618 but could extended and if so will update .

RSRUSDT.1Danalyzing the RSR/USDT daily chart, I observe that the price is currently trading at 0.007560, maintaining a bullish trajectory within a clearly defined ascending channel. The chart highlights a progressive pattern of higher highs and higher lows, indicating sustained upward momentum.
The immediate resistance level (R1) lies near the upper boundary of the channel, around 0.009000. A breakout above this level could pave the way for further bullish movement, potentially targeting the 0.010000 region and beyond. On the downside, the support at S1 (0.006500) aligns with the lower boundary of the channel. A break below S1 could lead to a test of deeper support at S2 (0.005042), marking a critical zone for buyers to re-enter the market.
The MACD (12, 26) indicator reflects a neutral-to-bullish outlook. The MACD line is slightly above the signal line, and the histogram is positive, albeit with subdued momentum. This suggests that while buyers are in control, the momentum might be weakening slightly. Monitoring these dynamics will be critical, particularly if the price approaches key resistance or support levels.
In terms of trend structure, the ascending channel provides a clear roadmap. If the price continues to respect this channel, it is likely to consolidate and potentially push higher. However, any break below S1 could signal a loss of bullish momentum, prompting a reassessment of the overall trend.
In conclusion, my outlook for RSR/USDT remains cautiously optimistic, as long as the price stays within the ascending channel. A breakout above R1 could confirm a strong bullish continuation, while a breakdown below S1 would suggest caution, with support at S2 providing a potential rebound zone. For now, I remain attentive to the price's behavior around these key levels, ready to adjust my analysis as the market evolves.

Trade Signal Notification: RSRUSDT - Buy OpportunityCurrency Pair: RSRUSDT
Direction: Buy
Enter Price: 0.00588
Take Profit: 0.006045
Stop Loss: 0.005597
Dear Traders,
Our analysis indicates a promising buy opportunity for the RSRUSDT trading pair. The current market conditions have been thoroughly evaluated using the EASY Quantum Ai strategy, which leverages advanced quantum algorithms to optimize decision-making and risk management. Here’s why we recommend entering a long position:
1. Technical Analysis: The currency pair has shown a consistent upward trajectory within its short-term moving averages, indicative of a bullish trend. The RSI levels suggest that the market is currently neither overbought nor oversold, offering an optimal entry point at 0.00588.
2. Market Sentiment: Overall market sentiment for RSR has been buoyant, largely fueled by positive developments within the project's ecosystem, which is lifting trader confidence.
3. Volume Patterns: Recent increases in trading volume align with our bullish outlook, suggesting heightened interest from key market participants.
By setting a Take Profit at 0.006045 and a Stop Loss at 0.005597, we've optimized the risk-reward ratio to maximize potential returns while safeguarding against volatility.
Happy trading, and stay tuned for further updates.
Best regards,
The EASY Quantum Ai Team

RSRUSDT 1WRSR ~ 1W
#RSR If you still have Conviction on the coin,. this support block would be a very good buying place for now. buy in stages. short term target of at least 20%++

Here's the latest update on #RSR/USDT:Here's the latest update on #RSR/USDT:
An Inverse Head & Shoulders (iH&S) pattern has been completed just below the key resistance zone. ☑️
This setup suggests a potential bullish breakout, signaling a move upward. 📈
Price Target:
✔️ Target: $0.048250

RSR D CorrectionAfter the upside movement shown in my previous analysis, we are now in correction mode, and once again the gray support zone comes in play.
This support is between the 50% and 61.8% pullback zone, reinforcing its importance.
I'll keep an eye for bullish reactions from this level.

RSRUSDT Is a Massive Dump Incoming? Key Level to Watch!Yello, Paradisers! Have you been tracking #RSRUSDT lately? The market is setting up for a potential bearish reversal, and it’s crucial to stay vigilant. Here’s what we see unfolding.
💎#RSR is currently trading within a rising wedge pattern, a classic bearish structure. If the price breaks down from this formation and also slices through the demand zone, we’ll likely see a strong bearish reversal. This could trigger a 30% downward move towards our target Bullish Order Block (OB) area, making it an ideal spot for a short position.
💎However, it’s not all clear-cut yet! There’s still a chance for RSR to retest resistance at $0.0077 or even spike higher into the OB to grab liquidity before a potential dump. This would present an opportunity for an aggressive short entry.
💎If the price closes above $0.00893, it invalidates our bearish outlook. Such a move would indicate continued upward momentum and render any short positions invalid.
Stay focused and always wait for the perfect setup before executing any position.
MyCryptoParadise
iFeel the success🌴

Is #RSRUSDT on the Brink of a Bullish Explosion? Key InsightsYello, Paradisers! 🌟 Could #RSRUSDT be setting the stage for a major breakout? Let's look at the latest analysis of the #ReserveRights:
💎We've been keeping a close eye on Reserve Rights, and the signals are pointing to a potential bullish continuation from the support zone at $0.0038.
💎After following a falling wedge for quite some time, #RSR has now broken above the descending resistance, and it's setting its sights on the next key level—the resistance at $0.0060. If RSR holds steady here, we could see a powerful rally, much like what we've observed in past trends.
💎But here's the crucial part: if momentum falters at this support level, there's a chance we might witness a dip, with a potential bullish rebound from the lower demand area between $0.0029 and $0.0032. This moment is pivotal, Paradisers—your vigilance is essential.
💎Keep a close watch on the price action, especially around the demand zone. A daily closure below this area could invalidate the bullish scenario and lead to further declines.
Stay focused, patient, and disciplined paradisers
MyCryptoParadise
iFeel the success🌴

RSRUSDT.PRSRUSDT.P is in bearish trend.
Potentially printing LH and LL.
No sign of reversal sellers are strongly active
we wait and watch for the breakout of last LL.

