POC support from 2022This is a POC level I found and marked up from May of 2022. With many test as resistance after that, I am hoping to see this hold as support. As of this posting, it has provided immediate support on the flush down, but we shall see if any real volume can come in here to push it higher. A breakout does depend on the broader market. BTC consolidation is great. BTC breakout is amazing.
RSRUSDT trade ideas


Reserve Rights $RSR going parabolicRSR absolutely crushing it this past week and still not even at macro resistance yet.
Question is, do we see some consolidation first before another god-like candle?
I don't think this thing sees green again for a long time.
The train has left the station.
Vatsik

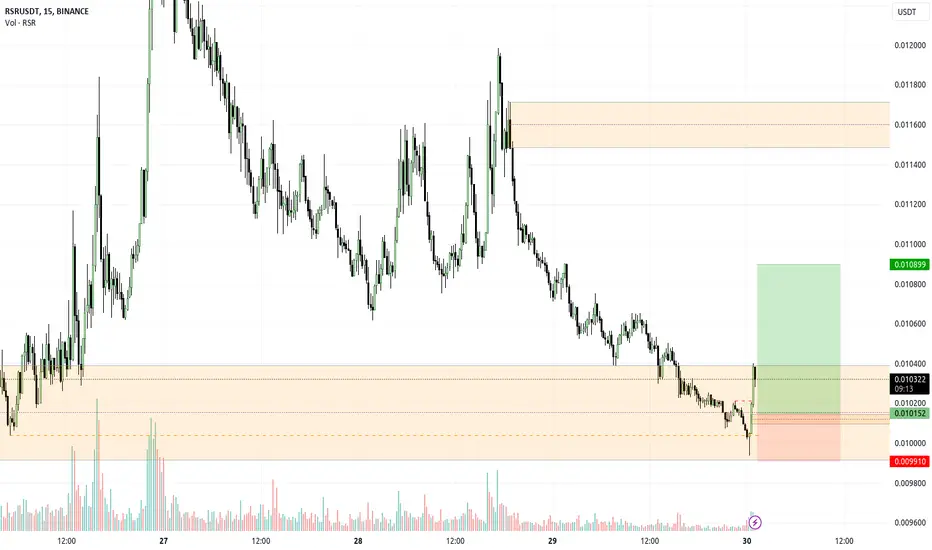
RSRUSDT(Reserve Rights) Daily tf Range Updated till 27-03-24RSRUSDT(Reserve Rights) Daily timeframe range. another beast of a performance from this one. the amount of profit provided from this one level by level is impressive. 0.012928 holding up for now, a retrace is make sense. local retrace point is at 0.009749.

Breakout from the support - RSR/USDTBINANCE:RSRUSDT (4H CHART) Technical Analysis Update
RSR is currently trading at $0.006682 and showing overall bearish sentiment
Price currently broke down from the resistance and showing continued downward momentum
Entry level: $0.006180
Stop Loss Level: $ 0.006682
TakeProfit 1: $ 0.005909
TakeProfit 2: $ 0.005715
TakeProfit 3: $ 0.005277
Max Leverage: 2x
Don't forget to keep stop loss.
Follow Our TradingView Account for More Technical Analysis Updates, | Like, Share and Comment Your thoughts.
Cheers
GreenCrypto

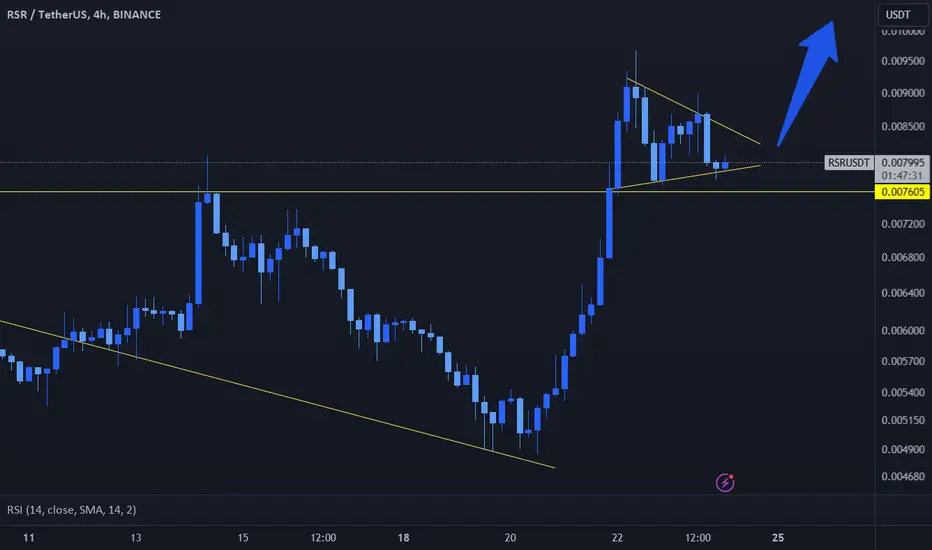
Breakout retest and up we goI feel like we're at a strong resistance here, but once it flips and retest this resistance I think it's up only. What do you think? Discuss!

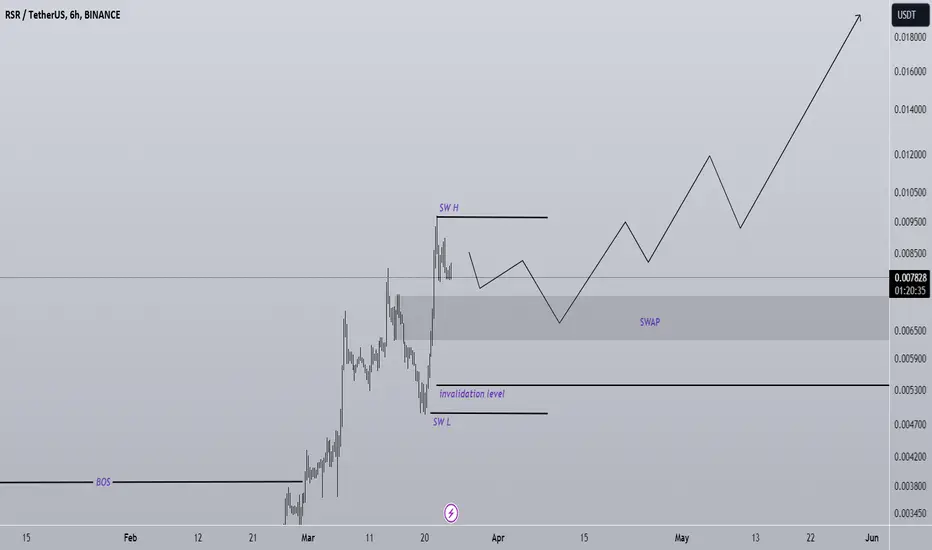
RSR buy setupAccording to the bullish structure of RSR, it seems that RSR intends to continue its upward path.
SWAP is a good place for buy/long positions
By maintaining the demand range, it can move towards the targets.
Closing a daily candle below the invalidation level will violate this analysis
Note that the financial market is risky, so:
Do not enter any position without confirmation and trigger.
Do not enter a position without setting a stop.
Do not enter a position without capital management.
When we reach the first TP, save some profit and try to move the stop continuously in the direction of your profit.
If you have any comments please post them, comments will help us improve our performance
Thanks
#RSR/USDT LONG#RSR
The price has been moving in a descending triangle since April 2022
We have a strong support area from which the price rebounded
The downtrend of the triangle has been broken and we are about to go up
This rise is supported by the moving average 100 break of 100.
The price is now 0.002941
First target 0.005484
Second goal 0.008678

$RSRUSDT Uptrend + AOTS setupthis one must be in the bag.
holding this for medium-long term.
flag pattern.
strong upward momentum.
weekly tf AOTS setup.
might as well reach 0.01 in april.
#RSR QUICK SHORT chart ideaBINANCE:RSRUSDT.P #RSR/USDT SHORT ENTRY
Leverage: 1x
Entries: $0.007839
Take profit 1: $0.007407
Take profit 2: $0.006641
Take profit 3: $0.004958
Stop Loss: $0.009301
NOTE: This is just my prediction. Be sure to use STOPLOSS and remember that I am not a financial adviser. your money, your risk!
Thanks
The sroced.

RSR is ready for the altseasonThere is a positive divergence in the RSI on the daily chart. Looks like it broke the falling wedge. It may want to touch the descending trend line again. However, it will push long-term resistance levels soon. It may be one of the leading altcoins in the bull run.

Reserve Rights is leaving accumulation phaseRSR has shown strength as of late, but better late than never.
Currently it is attempting to depart from its macro accumulation phase (high volume area) and is pushing the first level of interest (dotted horizontal). Additionally, it is interacting now with the 100ema on the weekly time frame, meaning I think a shorter term correction is due.
Long term, this chart looks fantastic. I think despite potentially seeing consolidation in the short term, this thing should push up toward our high time frame resistance (macro resistance) in the large red zone.
This is the first higher high out of the bear cycle, so things are really just getting started imo.
Don't sleep on it.
Vatsik

Reserve rights (RSR) USDT bullish on 3D TFBullish on 3 Day Timeframe
Reasons:
1) Positive reversal divergence on 3Day TF
2) Already in Uptrend
3) Above 20 Moving Average

RSR/USDT Bounce from the support, Indicating continue upward!💎 RSR has recently encountered significant developments in the market. Currently, RSR has successfully bounced from a support level that was previously a resistance, indicating potential for further upward movement towards testing our target Bearish OB area.
💎 However, if RSR revisits the support area around $0.0057, it needs to bounce again. Failure to bounce, and especially a breakdown below this support level, could lead to continued downward movement towards the demand area ranging from $0.0041 to $0.0037.
💎 When RSR reaches the demand area, a bounce is essential as it represents a crucial support level from previous bullish movements.
💎 Failure to bounce at this level and a subsequent breakdown below the demand area would signal a bearish trend, potentially leading to further downward movement.


RSRUSDT.PI think at RSRUSDT.P have an opportunity for take a LONG
Because Risk and Reward very ideal!

RSR/USDT Main trend. Wedge. Downward channel. 08 2023Logarithm. Time frame 1 week. This is more for understanding the trend and local area to work.
The price drop from the pumping maxima is -98%. That's a lot. It also means that in this crypto coin local great potential for profit taking, but globally - the death of the project.
Line chart.
Local trend Time frame 1 day (for work)

RSR/USDT Local trend. Double bottom. 08 2023Logarithm. Time frame 3 days. Medium-term work.
More locally reversal zone. Time frame 1 day.
Major trend . Time frame 1 week.
RSR/USDT Main trend. Wedge. Downward channel. 08 2023


RSR/USDT Gearing up for a Bullish Momentum? 👀🚀RSR Analysis💎Paradisers, let's zoom in on #RSRUSDT, where recent market trends signal an impending retest of the Bullish Order Block (OB).
💎At the moment, #ReserveRights is poised to challenge the demand zone once again. There's a strong likelihood for the price to rebound from this zone and climb upwards, setting its sights on the bearish OB region as the forthcoming milestone.
💎However, if SEED_DONKEYDAN_MARKET_CAP:RSR does not achieve the rebound and instead dips below the demand zone, we may observe a pullback to the Bullish OB vicinity around the $0.0021 mark, where it could gather the necessary momentum for another upward attempt.
💎Historically, the Bullish OB sector has been a critical point for triggering notable recoveries upon interaction. Nonetheless, a breach of this area, signaling a shift towards bearish tendencies, could lead to a pursuit of bullish momentum from a lower echelon.
💎If #RSR doesn't manage to utilize the momentum from this or any lower level, a continued descent may follow. As always, your ParadiseTeam is vigilantly monitoring the developments, ready to navigate you through these market fluctuations.

RSRUSDT(Reserve Rights) Daily tf Range Updated till 07-03-24RSRUSDT(Reserve Rights) Daily timeframe range. over 60%+ pump in a single day not bad. had a position from 0.002594 worked out nicely. now it cut through 0.005766 clean if can stay above this line 0.008675 is open to reach.

