Rune- Correction is probably overAfter an impressive 7x rally that began in mid-summer last year and peaked above 7, Rune initiated a correction in December, dropping 50% from its peak.
At this moment, Rune/USDT has reversed from the golden zone of the last leg up and appears poised to continue its upward trajectory.
As long as the 3.5 zone remains intact, I anticipate a retest of at least 7, if not even 10.
RUNEUSD trade ideas

THORChain breakdown - High probable scenarioThe odds are in favor for $RUNE.
Pattern seperation is key from my perspective.
Not financial advice and let's see how this is playing out.

RUNE 2023 - BTC 2019 (COMPARISON) part 1RUNE 2023 - BTC 2019 (COMPARISON) part 1
you can clearly see what im doing here, hard to tell where horizontal price levels (unfortunately) are as rune has exaggerated pumps compared to btc.. but the basic shape is there.
momentum shapes are the same, thats good. if this fractal is true its one more leg to go then its cool off for the whole market.
gl

RUNE Price Looks For A Breakout Run to $10Current Price Action: RUNE showcases a potential double bottom breakout in the daily chart, currently trading around $5.91 with a 3.33% increase.
Key Pattern: The formation of a triple white soldier pattern suggests a bullish momentum.
Breakout Signal: Breaking past $5.75 could trigger a rapid price surge.
Recent Recovery: RUNE's price has risen by 14.55% this week, forming three consecutive bullish candles.
Support Zone: A successful retest at the critical $4.96 level, supported by the 50-day EMA and the 38.2% Fibonacci level.
Technical Indicators:
MACD: Indicates a bullish trend with a recent crossover.
EMA: Shows a strengthening uptrend with the 50D and 200D EMAs.
Bullish Outlook: If RUNE maintains above the $5.75 level, especially the 23.60% Fibonacci level, a breakout past $6 could pave the way to $10.
Downside Risk: A fall below $5.75 might lead to a retest of the $4.96 support level, crucial as it's the 50% retracement level from $3.5 to $5.5.
Overall Sentiment: RUNE's current trend and technical indicators point to a positive outlook for 2024, with potential to hit the $10 mark.
Investment Consideration: The current pattern and momentum might offer a good entry point for investors eyeing the $10 target.

RUNEUSD - Inverted H&S Structure Right now I expect we will experience the right shoulder, acting as a bull trap.
The head of this inverted structure is quite spread out but there is a definite left shoulder evident.
The right shoulder finishing wave allows a big bull move, I have shown this with the bars pattern tool.

IS RUNE Crashing under $4.96 This Week?Bullish Reversal to $6.5: RUNE recently completed a bullish reversal, reaching $6.5 following a triangle breakout rally.
Triple White Soldier Pattern: RUNE's price action in the daily chart shows a triple white soldier pattern, typically indicating a strong bullish trend.
Potential Breakout to $10: A successful breakout above $6.5 could trigger a rapid rally in RUNE's price, potentially reaching as high as $10.
Recent Bearish Attack: RUNE faced a sudden bearish turn this week, leading to a decline in its price, in line with the broader market correction.
Testing Crucial Support at $4.96: RUNE is currently testing a pivotal support level at $4.96, aligned with the 50-day EMA and 38.2% Fibonacci retracement level.
Current Trading Price: RUNE is trading at $5.511, with a significant intraday fall.
Risk of a Potential Crash: If RUNE breaks below the crucial support of $4.96, it risks a further crash, potentially testing lower support levels.
Volume Reduction Indicates Market Indecision: A decrease in trading volume suggests market uncertainty and could prelude either a bullish reversal or a bearish continuation.
Technical Indicators - RSI and EMA: The RSI suggests a bullish trend, while the EMAs indicate strong underlying demand for RUNE.
Critical Fibonacci Retracement Levels: The $4.96 support and $6.5 resistance levels are key Fibonacci retracement levels, pivotal for RUNE's future price direction.
Market Sentiment's Influence on RUNE: The broader market sentiment will significantly impact RUNE's price movement, especially in determining its potential to amplify bullish momentum.

Can RUNE Rise To $10 In 2023?Bullish Reversal: RUNE marks a bullish reversal hitting $6.5 post a triangle breakout rally.
Triple White Soldier: Daily chart showcases a triple white soldier pattern in the RUNE price action.
Targeting $10: A potential breakout beyond $6.5 could drive a swift rally targeting $10 for RUNE.
Top Performer: RUNE ranks among top performers this week, fueling its remarkable uptrend.
Yearly Growth: YTD growth at 194%, exemplifying RUNE's sustained bullish momentum in 2023.
Rounding Bottom: 4H chart reveals a rounding bottom pattern, hinting at a potential breakout.
Current Price Action: Presently trading at $6.36, displaying a 21.20% jump in the last three days.
Technical Support: EMA and RSI indicators signal strong bullish trends, reflecting solid demand for RUNE.

Will RUNE Lead To A Bullish Break?Bullish Pennant Formation: RUNE displays a bullish pennant pattern in the daily chart, indicating a potential breakout.
Golden Crossover Tease: The 50-week and 200-week EMAs hint at a golden crossover in the daily chart, signaling a strong uptrend.
Trendline Breakout Projection: A breakout in the weekly chart trendline could propel RUNE price above $10, initiating a significant uptrend.
Volatility Near Overhead Trendline: Despite attempts at a bullish breakout, RUNE price remains volatile near the overhead trendline, reflecting ongoing struggles.
Weekly Uptrend Challenges Resistance: Weekly trend challenges overhead resistance, hinting at a prolonged bull run despite a 5.43% drop last week.
Technical Indicators - MACD & EMA: MACD shows declining trend but minimal bearish gap, while the 50D and 200D EMAs reflect a strong underlying demand for RUNE.
Current Price & Intricacies: RUNE trades at $5.31, with an intraday fall of 2.73%, showing volatility close to the overhead trendline.

Bearish update $AERGO AERGO looks bearish to our target below and might still extend lower after that range

RUNE - 1D - Break out - No resistance up till $10RUNE looks really good. On the daily time frame there is no resistance up till $10 since the price broke out at $3,20. This one looks really good for some nice profits the coming days. If RUNE continues this rally you can make a profit of 140% from current price.

RUNE - 1W - 300% increase possibleOn the weekly graph the price is breaking out a Falling Wedge and is moving to the 200 day moving average (purple line). Although there are some small restistance levels visible on the daily graph. These will don’t last long as I can see no resistance levels on the weekly graph till $12.
Psychologically the main target could be $10 and max. $12. Which is an increase of 300-400%.
Hodl strong and don’t let Influencers fool you with short targets. The Total Crypto Market already broke out of a very important resistance level and is ready to increase up to 2.2T.
Focus on the Long Term Horizon. Set your targets and enjoy your time.

RUNEUSD Testing the 1W MA100. This is how it will reach 5.0000THORChain is rising very aggressively, the same kind it did in early August, naturally turning overbought on the 1D timeframe (RSI = 78.104, MACD = 0.209, ADX = 49.344). In doing so, it reached the 1W MA100 for the first time since May 9th 2022, which is the major Resistance of the new Bull Cycle.
The pattern that seems to be standing out is a Channel Up and the current rise is the new bullish leg to HH. Along those lines, we expect a rejection near the +115% mark and pull back to the 0.382 Fibonacci level, where we will place our new buy. Structurally, the target will again be a +115% rise (TP = 5.000).
## If you like our free content follow our profile to get more daily ideas. ##
## Comments and likes are greatly appreciated. ##

RUNE - Increase of 44% possibleRUNE is almost breaking through the Fib. 1.0 level and if the trend is strong enough, the price can increase with approx. 44%.

RUNE - Waiting for another dropHi All -
As per my elliott counts Rune is ine wave 2 correction. This could be a complex correction and we would not know it has ended once it has ended.
So as of now i see its in the C wave of correction. wave 4 of the C wave looks like a running flat whose wave B is quite complex.
I am expecting a drop here. bearish divergence is quite visible. One more 5 wave down now and we can put some bits in.
Just my opinion and discussion purposes only. share your counts with me. lets try to steal from market together.
Pama

In-depth analyses of DXY, BTC, ETH and DOTThe markets are brewing some nice trading ideas. Onwards Thorchads!

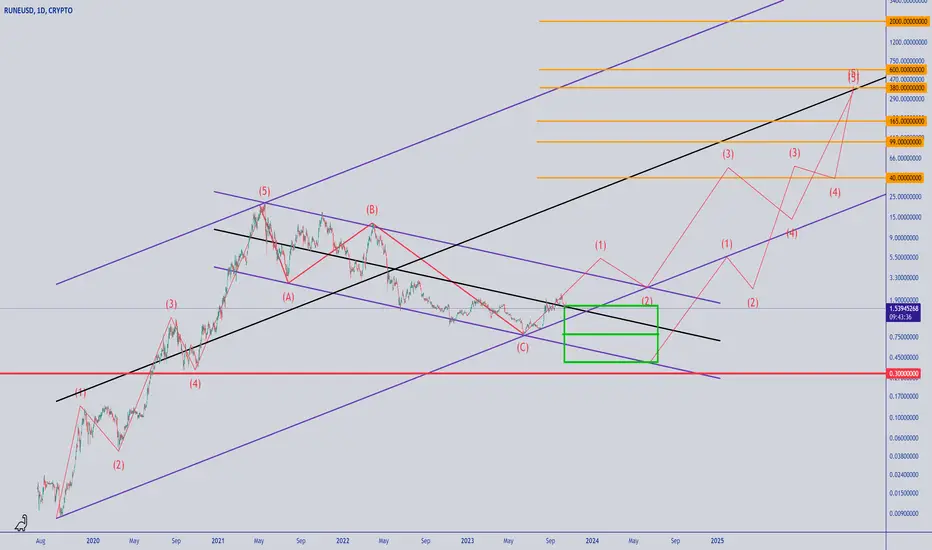
#THORChain #RUNE Long-Term chart analysis#THORChain #RUNE Long-Term chart analysis
According to the chart and the wave counter marked on it, the downward trend of this currency is probably over. And we can expect the beginning of its long-term upward movement. But since there is a possibility that we will have more decline ahead, so three entry steps are suggested at the current price of $1.53, then the price of $0.80 and finally the price of $0.40.
The primary target of the possible rise is the price of $40 by the end of 2025, which has a good risk-to-reward ratio.
The target are:
target1: 40$
target2: 99$
target3: 165$
target4: 380$
STOP LOSS: 0.30$
TIME: 1 YEAR
Will RUNE Jump To $2?Rising Channel: RUNE price action is in a bullish channel on the daily chart.
200-day EMA Bounce: A sharp bounce from this level sustains the uptrend.
50-day EMA: A close above this level could pump RUNE to $2.15.
YTD Growth: RUNE has a year-to-date growth of 33%.
Current Price: RUNE is trading at $1.68.
38.20% Fibonacci: RUNE is testing this crucial level.
Long Tail: A long tail candle formation avoids a downfall.
Intraday Jump: RUNE has an intraday growth of 2.75%.
RSI Status: The RSI is moving sideways, preparing for a bounce back.
20-day EMA: This level provides a cushion for RUNE.
Golden Crossover: The 50-day and 200-day EMAs are positively aligned.
Resistance Levels: RUNE may face resistance at $1.86 and $2.15.

RUNEUSD Megaphone rebound aiming higher.THORChain (RUNEUSD) is testing the 1D MA50 (blue trend-line) as short-term Resistance after a clear-cut bounce at the bottom of the Megaphone pattern and just above the 1W MA50 (red trend-line). This mobilizes the 1W MA levels to come into focus and justifies a short-term (at least) buy towards 2.5000 (top of Megaphone and expected contact with the 1W MA100 (yellow trend-line)).
-------------------------------------------------------------------------------
** Please LIKE 👍, FOLLOW ✅, SHARE 🙌 and COMMENT ✍ if you enjoy this idea! Also share your ideas and charts in the comments section below! This is best way to keep it relevant, support us, keep the content here free and allow the idea to reach as many people as possible. **
-------------------------------------------------------------------------------
💸💸💸💸💸💸
👇 👇 👇 👇 👇 👇

RUNE EMA's crossing upThe RUNE EMA's have crossed to the upside indicating that this crypto could be reversing its trend from down to up. If this is the case, it will have more upside left.
While it has moved quite a bit, the strength it has shown during this last crypto down move is encouraging. RSI is also showing strength and we have a nice slope up on MACD.
There is no telling if we will get a pullback or not, but for a longer-term hold, rune looks promising.

RUNEUSD Rally far from over.RUNEUSD is trading inside a Channel Up, which after the Golden Cross on the (1d) time frame, is supported firmly by the MA50 (1d).
It has already crossed above Falling Resistance (1) of the Bear Cycle and only one remais (Falling Resistance 2) but of course will take time.
The final barrier before that test is Resistance (1) at 3.1500.
Trading Plan:
1. Buy on the current market price and as long as the MA50 (1d) supports.
Targets:
1. 3.1500 (Resistance 1).
Tips:
1. The RSI (1d) has diverged from the typical drop straight to 30.00 after being overbought above 70.00. This consolidation is a formation seen during impressive past rallies for RUNE.
Please like, follow and comment!!

RUNEUSD Close to making a new 12 month High!THORChain / RUNEUSD is testing yet again Resistance A (1.97500), after after 3 failed attempts to cross over it in the past 6 weeks.
That would favor a bearish move if at the same time the 1week MA50 didn't hold being the Support.
If it closes the week over Resistance A, it will the signal to buy and target 3.5000 (1week MA200). That will be inside the 0.5-0.382 Fibonacci range, a hot zone for the market as it was the long term Support turned to Resistance during the Bear Market.
Expect consolidation inside this range and then another run to 5.000 as the 1week MACD is marginally over the 0 mark, meaning that there is still considerable upside to it.
Follow us, like the idea and leave a comment below!!

RUNEUSD is falling for wave 2 or B. As we can see the completion of 5 impulse waves retracement around fibo 0.5 to 0.618 is expected for wave b or wave 2.

RUNEUSD This Bull Flag can take it to 3.1500 by end of the yearWe last looked into THORChain (RUNEUSD) 3 weeks ago (see chart below) when we called for a pause of the enormous uptrend within the Resistance Zone:
As expected, the price got rejected on the 1.9750 Resistance and pulled-back to the 0.382 Fibonacci retracement level. Needless to say that after breaking above the Falling Wedge pattern, as well as the 1W MA50 (red trend-line), the cryptocurrency has entered a new long-term bullish trend. The very same 1W MA50 has turned into a Support and held twice already (August 18, 16), while the 1D MA50 (blue trend-line) is crossing today above the 1D MA200 (orange trend-line), forming a Golden Cross.
Now the last 1D Golden Cross (February 17) had a bearish outcome but at the time not only was the price below the 1W MA50 but also the 1D MACD failed to form a Bullish Cross. As a result, it the 1D MACD forms the Bullish Cross (which is in course of completing in 2 days), we expect the current consolidation to be just a Bull Flag pattern that will break this time above 1.9750 (Resistance 1) that has been holding since February 02. Our long-term target is 3.1500 (Resistance 2) on the long-term, which is the August 11 2022 High.
-------------------------------------------------------------------------------
** Please LIKE 👍, FOLLOW ✅, SHARE 🙌 and COMMENT ✍ if you enjoy this idea! Also share your ideas and charts in the comments section below! **
-------------------------------------------------------------------------------
💸💸💸💸💸💸
👇 👇 👇 👇 👇 👇
