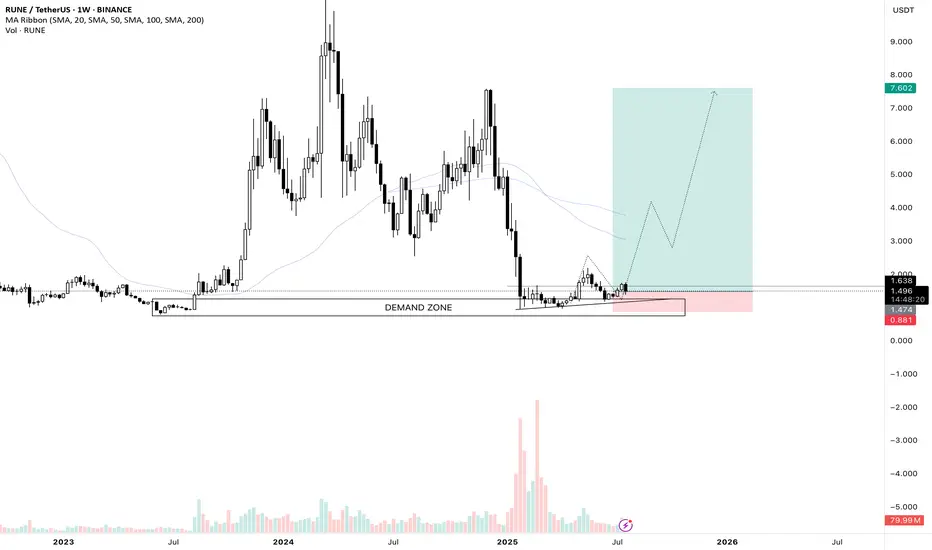
RUNE/USDT Weekly swing set upI love this chart and I entered a long trade on futures. After a sharp decline of the price we are retesting a huge weekly demand zone, we saw the volume really spike up on this area. If Ethereum continues its run which I believe so, I think Rune could really perform well. It is a swing trade so I am going to keep this position open for a few months and see how it develops.
Like and share guys and leave your thoughts on the comment section!
See you on the next one.
RUNEUSDT trade ideas
RUNE (Y25.P2.E1).Looking to short the macroHi Traders,
RUNE has some more highs to do, however based on the structure, I would not bet it will go much. My interests is finding that trade to short when it comes to Alt coins.
With my TA approach, Wave 5 might just equal Wave 1 length. Along with some confluences of FVP levels, we might just get this right. Time will time.
All the best,
Regards, S.SAri

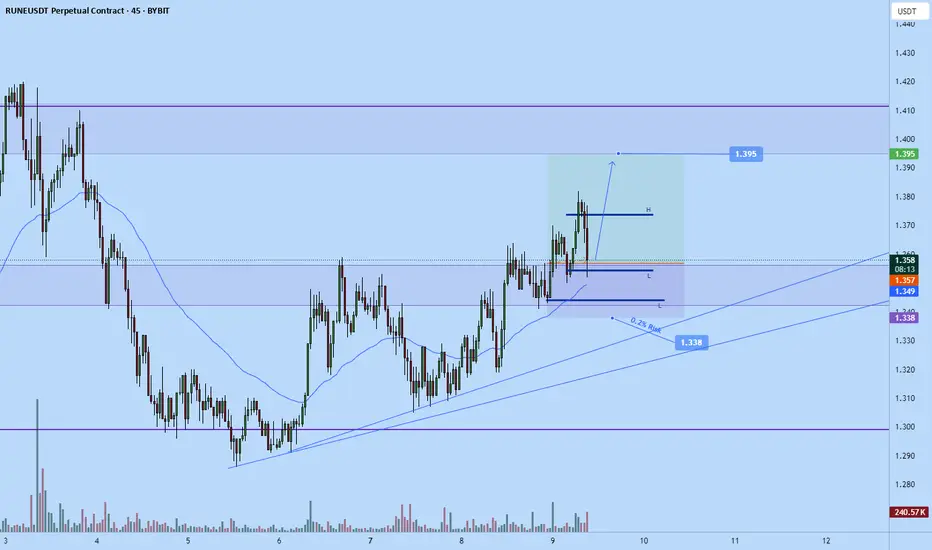
Rune long to $1.645Time sensitive
Just went long on rune
Stop: $1.527
Tp1: $1.59
Tp2: $1.645
DTT setup

THORChain 1,784% Profits Potential & Technical AnalysisHere we can see THORChain sandwiched in-between EMA89 and EMA55. The action is not happening above EMA89 but this shouldn't be considered bearish, more like "we are not there yet." Or, "still consolidating but with a bullish bias."
The bias is bullish because the low came in early February 2025. So that is more than 5 months ago. A bearish trend or bearish continuation would require lower lows in those 5 months. The fact that after the low in February there was a small recovery and this recovery ended as a higher low on the retrace, means the downtrend reached its end. Since the downtrend is over, we are seeing consolidation, accumulation before the market turns. The turning is the bullish cycle, the uptrend. And we are in the process of seeing this change materialize into the market, price and chart.
The minimum target is the "baseline level" between $7.44 and $6.20. The target to aim for should be $18 and if you are feeling optimistic then $28. I've seen this project grow incredibly strong in the past so I wouldn't be surprised if it ends up moving even higher.
This is a simple chart. What goes down, must come back up; specially when we are talking about Crypto. The best financial market in the whole world. Young, but highly profitable. Risky? I don't know... It is risky to be young. But the potential rewards make up for any risk the market carries. We can take risk when we are young. We should. You play it safe because you are old. No risk, no fun. Plan ahead, success is yours.
Namaste.

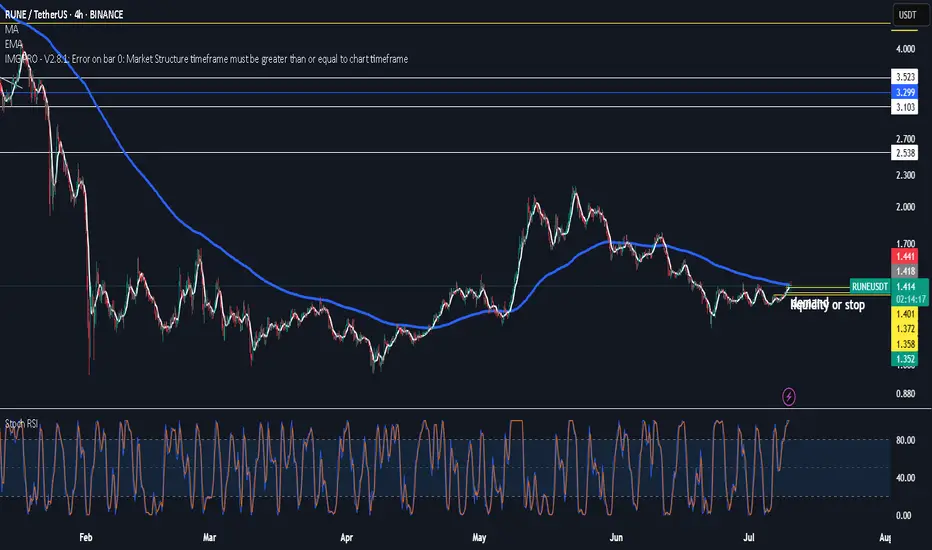
$rune- $2.58reclaim of 200 ema on H4
pop
retest
liquidity under 200 ema
then golden cross
send to valhalla
another 2hrs watching for reclaim
RUNEUSDT 1W AnalysisRUNE ~ 1W Analysis
#RUNE Buy back gradually from here with a short term target of at least 20%+ from this support block.
Rune Big weekend dump to $1.257Stop: $1.522
Tp: $1.257
potential early close at $1.41
market is trending down, ran up high so its correcting likely place for reversal up is $1.41 if fails to hold which I think will be the case then next likely place for strong potential demand to flow in is $1.257
Given the current war fud between Israel and Iran, we might get an aggressive dump down this weekend towards the area.

Rune short to $1.784Just recently opened a short position on rune. Anticipating further fall down to $1.784 before any strong continuation sign.
So far the rune market failed to find a strong enough support to attract enough demand hence why I think it will fall lower.
Time sensitive

Rune long to $2.2Recently opened a long position on rune. Am targeting $2.11-2.5 area
Stop: $1.873 or lower
With bitcoin just confirming a new ath I anticipate altcoins like this one to follow suit soon.

RUNE Ready for a Big Move? Accumulation Breakout Incoming!Current Market Structure:
#RUNE has been in an accumulation phase after a prolonged bearish trend. The price is consolidating, forming a potential Wyckoff Accumulation pattern. No further bearish signs are present except for the previous break of a strong support level.
Key Levels to Watch:
🔹 Support: $0.788 (previous level)
🔹 Resistance: $2.5 (breakout zone)
🔹 Accumulation Range: $1.13 – $1.6
Trading Plan:
🔹 A confirmed breakout above the resistance level will signal the start of a bullish trend.
🔹 Ideal long entry on breakout with a retest confirmation.
🔹 Stop-loss below accumulation range to minimize risk.
🔹 Targeting $7 as the next resistance level.
What do you think?
Will #RUNE break out soon, or are we in for more sideways movement? Share your thoughts in the comments!
Like & Follow for more trade setups and insights!

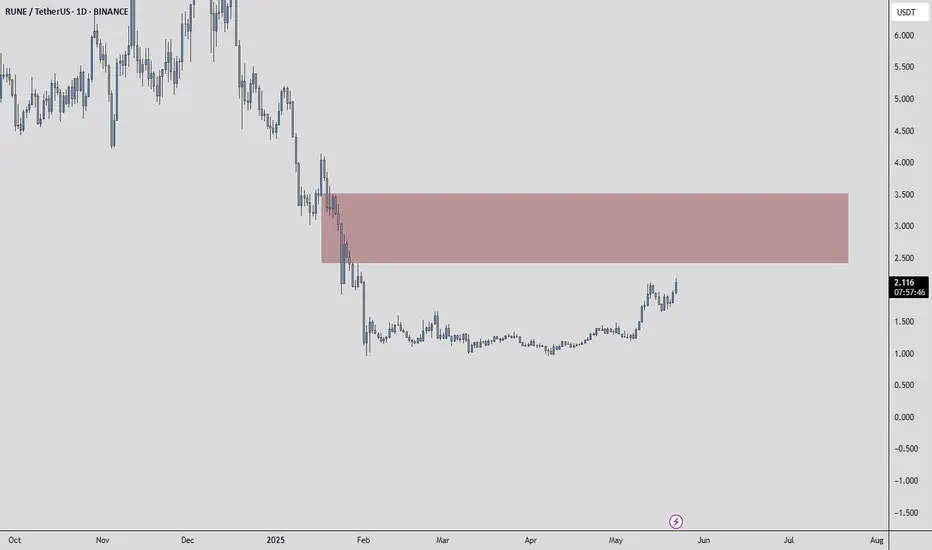
RUNEUSDT | Red Box Sell Wall Still HoldingRUNEUSDT is currently facing a strong resistance zone, clearly marked by a heavy sell wall inside the red box .
Until that level is broken with volume and confirmed as support, my bias remains negative and I stay short-focused .
“I will not insist on my short idea. If the levels suddenly break upwards and do not give a downward break in the low time frame, I will not evaluate it. If they break upwards with volume and give a retest, I will look long.”
No need to predict. Let the structure guide you.
📌I keep my charts clean and simple because I believe clarity leads to better decisions.
📌My approach is built on years of experience and a solid track record. I don’t claim to know it all but I’m confident in my ability to spot high-probability setups.
📌If you would like to learn how to use the heatmap, cumulative volume delta and volume footprint techniques that I use below to determine very accurate demand regions, you can send me a private message. I help anyone who wants it completely free of charge.
🔑I have a long list of my proven technique below:
🎯 ZENUSDT.P: Patience & Profitability | %230 Reaction from the Sniper Entry
🐶 DOGEUSDT.P: Next Move
🎨 RENDERUSDT.P: Opportunity of the Month
💎 ETHUSDT.P: Where to Retrace
🟢 BNBUSDT.P: Potential Surge
📊 BTC Dominance: Reaction Zone
🌊 WAVESUSDT.P: Demand Zone Potential
🟣 UNIUSDT.P: Long-Term Trade
🔵 XRPUSDT.P: Entry Zones
🔗 LINKUSDT.P: Follow The River
📈 BTCUSDT.P: Two Key Demand Zones
🟩 POLUSDT: Bullish Momentum
🌟 PENDLEUSDT.P: Where Opportunity Meets Precision
🔥 BTCUSDT.P: Liquidation of Highly Leveraged Longs
🌊 SOLUSDT.P: SOL's Dip - Your Opportunity
🐸 1000PEPEUSDT.P: Prime Bounce Zone Unlocked
🚀 ETHUSDT.P: Set to Explode - Don't Miss This Game Changer
🤖 IQUSDT: Smart Plan
⚡️ PONDUSDT: A Trade Not Taken Is Better Than a Losing One
💼 STMXUSDT: 2 Buying Areas
🐢 TURBOUSDT: Buy Zones and Buyer Presence
🌍 ICPUSDT.P: Massive Upside Potential | Check the Trade Update For Seeing Results
🟠 IDEXUSDT: Spot Buy Area | %26 Profit if You Trade with MSB
📌 USUALUSDT: Buyers Are Active + %70 Profit in Total
🌟 FORTHUSDT: Sniper Entry +%26 Reaction
🐳 QKCUSDT: Sniper Entry +%57 Reaction
📊 BTC.D: Retest of Key Area Highly Likely
📊 XNOUSDT %80 Reaction with a Simple Blue Box!
📊 BELUSDT Amazing %120 Reaction!
📊 Simple Red Box, Extraordinary Results
I stopped adding to the list because it's kinda tiring to add 5-10 charts in every move but you can check my profile and see that it goes on..
RUNEUSDT | Long | Targeting POC | (May 22, 2025)RUNEUSDT | Long | Targeting POC & Volume High in Triangle Structure | (May 22, 2025)
1️⃣ Quick Take: RUNE is consolidating inside a triangle while respecting key support. Despite liquidation risks below, the broader structure points to potential upside targeting the top of the range.
2️⃣ Trade Parameters:
Bias: Long
Entry: $1.00–$1.10
Stop Loss: Below $0.98 (under key wick zone with high liquidation probability)
TP1: $1.86
TP2: $5.20
🪙 Final 5% to remain open beyond $5.20 if the trend continues
3️⃣ Key Notes:
Resistance has flipped into support on the chart—expecting it to hold.
Triangle pattern forming, with potential to break out toward Value Area High or POC from volume profile.
Limit sell orders are visible above—liquidity magnet if price starts moving fast.
Order flow shows spot selling slowly, possibly by a market-making bot, while open interest is stable and healthy.
Funding rate is around 0.017—slightly favoring longs, but not overheated.
Liquidation wick below $1.00 could occur, but structure suggests a higher high is more probable in the current setup.
4️⃣ Follow-up: Will reassess and potentially compound on dips or wick recoveries. Will update the trade if structure confirms breakout.
Please LIKE 👍, FOLLOW ✅, SHARE 🙌 and COMMENT ✍ if you enjoy this idea! Also share your ideas and charts in the comments section below! This is best way to keep it relevant, support us, keep the content here free and allow the idea to reach as many people as possible.
Disclaimer: This is not a financial advise. Always conduct your own research. This content may include enhancements made using AI.

Buy Trade Strategy for RUNE: Backing Cross-Chain Liquidity PowerDescription:
This trading idea focuses on RUNE, the native token of the THORChain protocol, a decentralized liquidity network that enables cross-chain swaps without the need for wrapped tokens or centralized intermediaries. RUNE plays a critical role in facilitating and securing liquidity across different blockchain networks, making it a unique asset in the DeFi ecosystem. As demand for seamless interoperability between blockchains grows, THORChain’s utility and relevance are also expected to rise, positioning RUNE as a potentially strong performer over the long term.
The token is used for governance, bonding, and liquidity incentives, creating a robust token economy. THORChain's ability to attract capital and maintain decentralization further strengthens RUNE's fundamentals. However, like all crypto assets, RUNE remains subject to market volatility, technological risks, and changing regulatory landscapes.
Disclaimer:
This trading idea is for educational purposes only and does not represent financial advice. Trading cryptocurrencies like RUNE involves a high level of risk, including the potential for complete capital loss. Always perform your own research, assess your financial situation, and seek advice from a licensed financial advisor before making investment decisions. Past performance is not indicative of future outcomes.

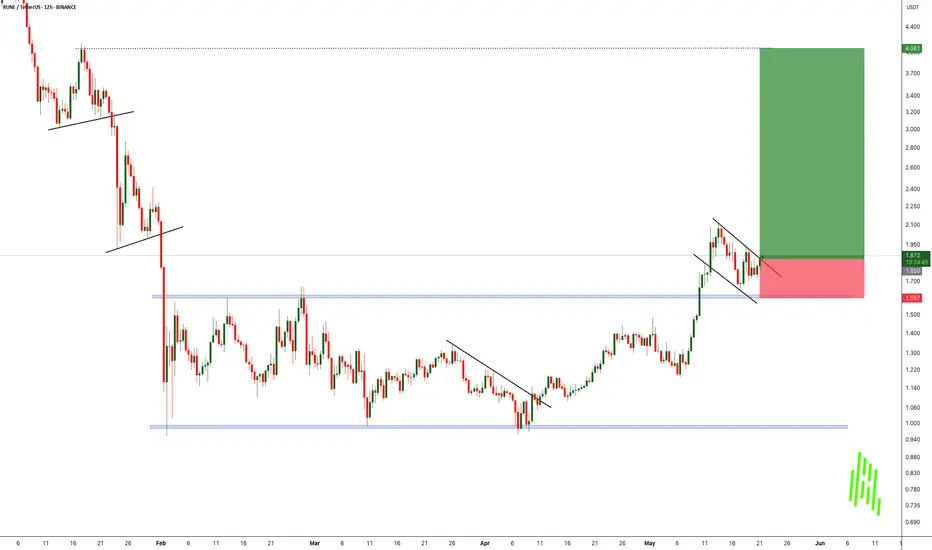
RUNEUSDT Breakout and Bull Flag Forming!!After nearly three months of tight consolidation, BINANCE:RUNEUSDT has finally broken out of its range-bound “box” structure. a powerful sign that the market is ready to move. This type of breakout often signals the end of indecision and the start of a strong directional trend.
What makes this setup even more exciting is the formation of a bull flag pattern right after the breakout. Known as a classic continuation pattern, the bull flag usually signals that the asset is simply pausing before its next leg up. The tight pullback within the flag is showing low-volume correction. A bullish sign that buyers are still in control.
With this confluence of a range breakout followed by a bull flag, BINANCE:RUNEUSDT is flashing all the signs of a potentially explosive move to the upside. However, it’s important to stay disciplined – always manage your risk and keep stop losses in place below the flag structure or previous support levels.
Next move could be strong. Stay sharp and ride the wave!
BINANCE:RUNEUSDT Currently trading at $1.87
Buy level : Above $1.86
Stop loss : Below $1.6
Target 1: $2.2
Target 2: $3
Target 3: $4
Max leverage 3x
Always keep stop loss
Follow Our Tradingview Account for More Technical Analysis Updates, | Like, Share and Comment Your thoughts
Buy Trade Strategy for RUNE: Unlocking Cross-Chain LiquidityDescription:
This trading idea is based on RUNE, the native asset of the THORChain protocol, a decentralized liquidity network that allows cross-chain swaps without wrapping or centralized intermediaries. RUNE serves a vital role in securing the network, enabling liquidity pools, and facilitating seamless swaps between assets across multiple blockchains like Bitcoin, Ethereum, and BNB Chain. As interoperability and cross-chain functionality become key pillars of the evolving DeFi landscape, THORChain and its native token RUNE are well-positioned to gain long-term relevance and utility.
The protocol’s strong fundamentals, unique cross-chain capabilities, and growing ecosystem contribute to the investment case for RUNE. However, like all crypto assets, RUNE remains subject to high volatility and market risks influenced by broader economic conditions, regulatory actions, and sentiment shifts.
Disclaimer:
This trading idea is for educational purposes only and does not represent financial advice. Investing in cryptocurrencies like RUNE involves a high degree of risk, including the potential for total loss of capital. Always perform your own research, assess your risk tolerance, and consult a financial advisor before making investment decisions. Past performance is not indicative of future outcomes

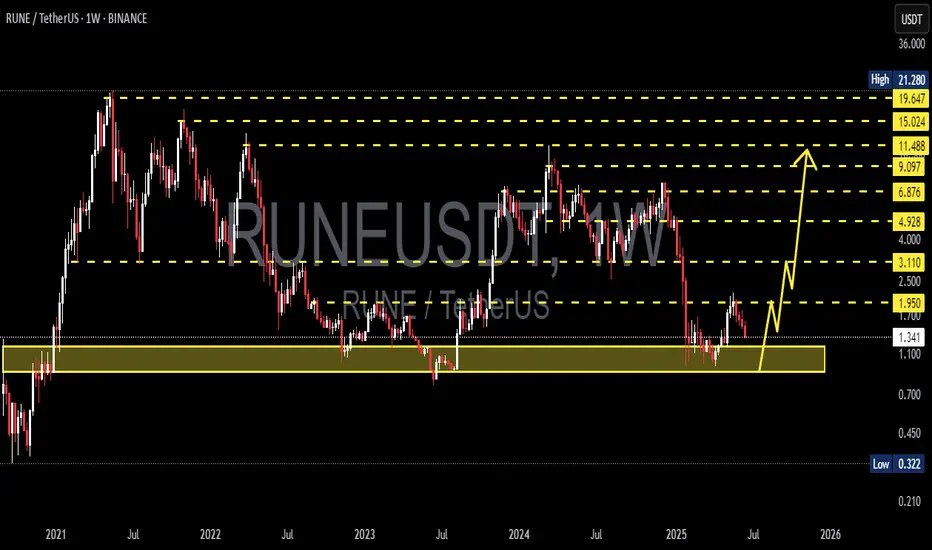
Thorchain "Back To Baseline" Easy 280% Profits TargetThorchain (RUNEUSDT) is no longer bearish, the bullish bias is now fully confirmed and this statement is supported by many chart signals. Let's look at those.
First, there is a strong and classic reversal bottom formation, the Adam & Eve pattern.
This pattern was completed when RUNEUSDT moved above its base (black line on the chart).
This pattern on its own is a strong reversal signal but that is not all, today RUNEUSDT is moving above EMA89 and recently conquered EMA55 daily for the first time as resistance. This is happening with three green daily candles and the strongest bullish momentum since March 2024.
Current action is indicative of so much more to come, but here we will focus on something basic and simple, the "baseline."
This is a very easy target, RUNEUSDT is set to test the December 2024 resistance zone, the price zone from where it took the plunge. Obviously, this resistance will break after some challenge easy, but this is the first and main level that will be tested on this bullish wave. That's a very easy 280% profits target in the coming months, very easy with a strategy based on buy and hold. You can't go wrong. You will be happy with the results.
Thorchain will grow, Bitcoin will grow, the Altcoins will continue growing and what you are witnessing now, is only the start.
Thanks a lot for your continued support.
Namaste.

rune - caution there was a big problem with it i dont know Im just seeing opportunities to go long on good value tokens.
None of this is financial advice, im just pointing out that if you are patient and know what you are looking for then the right times to trade are easy to spot.
my long strat has triggered

Break of Structure and possible reversal on RUNE PERP M15 TFPrice broke structure at the 1.295 region after a bullish run in the last 24-48hrs.
A short trade seems feasible with 1:6 RR
We wait for bearish reaction at the FVG created before the BOS.
TP target is sell side liquidity zone below.

RUNE/USDT : BUY LIMITHello friends
Given the growth in price and the entry of buyers, now that the price is in the ascending channel, we can buy in stages and with risk and capital management and move towards the specified goals.
*Trade safely with us*

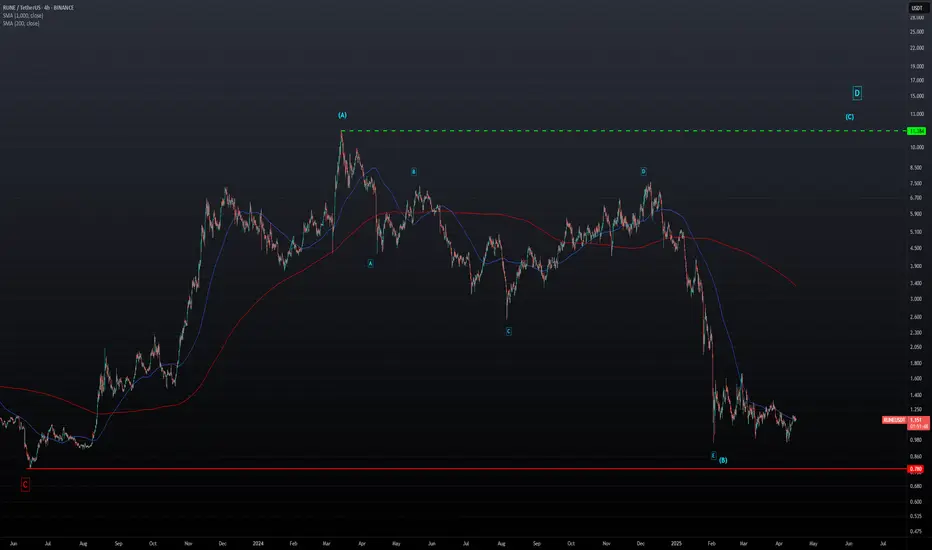
THORCHAIN - Do You Think It's Possible?Could this count actually be valid? It might seem like a stretch given the sharp drop we just saw—but what if Wave D still needs to play out? Is it possible we see the RUNE token hit $11 again in this cycle?
It doesn’t sound so far-fetched if you’ve been following the Bitcoin pattern I mentioned in my recent post about AVAX (linked below). At the end of the day, it all comes down to solid risk management to see how this plays out.
RUNE Long Trade SetupRUNE is close to thr break of its trendline on weekly TF, I'll be looking for a breakout of trendline and will be opening my long position at the restest of the trendline support at 1.21. Placing my TP1 at 1.41, TP2 at 1.60 - 1.68, SL below the previous lows & liquidity sweeps at 1.09.

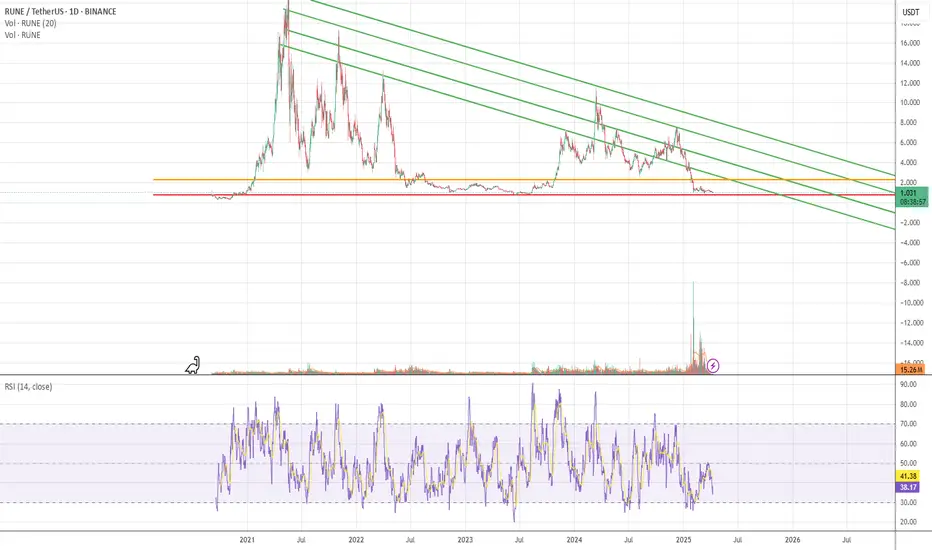
RUNE - Make or break ...RUNE is currently in a prolonged downtrend, respecting the descending resistance lines since its peak. Price is now approaching a critical horizontal support zone:
🔴 Key Support: $0.75
🟠 Minor Support Zone: $1.00 – $1.10
🟢 Major Resistance Levels:
$2.50 (First trendline test)
$4.00 (Second trendline)
$6.00+
The price action is compressing near the lower boundary of the descending channel, while RSI is drifting toward oversold levels (RSI ~37.85). Historically, RUNE has seen relief rallies from this region.
⚠️ Scenarios to Watch:
Bullish:
Price holds above $0.75 and RSI enters oversold territory.
Break and close above $1.10 could trigger a relief rally toward $2.50.
Confirmation would come with increasing volume and break of descending trendline.
Bearish:
Breakdown below $0.75 support could open doors for further downside.
Possible targets below $0.75: psychological levels at $0.50 or lower, especially if volume increases on the breakdown.
📈 RSI Indicator:
RSI nearing oversold, currently ~37.85.
No confirmed bullish divergence yet, but worth watching closely for potential reversal signals.
🧩 Strategy Notes:
Conservative traders: Wait for reclaim of trendline and a close above $1.10–1.20 for safer entry.
Aggressive traders: Look for bullish RSI divergence or price action confirmation around $0.75 for a potential bounce play.
Risk management is crucial — set tight stop losses below critical levels.
🎯 Summary:
RUNE is at a make-or-break zone. $0.75 is a crucial historical support. A bounce from here could send the price towards the first resistance at $2.50, while a breakdown may lead to further bearish momentum. Watch RSI and volume for clues!