Spot holdingI recently found RUNE, and since then, it became one of my favorite currencies. It presents good movements and fast recoveries.
Now, it is on a strong support which makes it a candidate for buying and holding.
Each of the blue lines beneath the white support can also be used for step purchases.
I suggests do not put more than 5 percent of your capital on small currencies.
RUNEUSDT trade ideas

RUNEUSDT : A Bullish pullback in bearish trendSharp downfall, liquidity of the upside for the bears.
the movement that may follow is the drive down the price to 1.58 level and take it up to to 1.8 to even 2.02 level before bears take the full charge in December.

Rune Growth Spurt: Buy Your Ticket to Profit!"**Short fundamental**
Rune coin is a cryptocurrency that was created in 2019. It is based on the Ethereum blockchain and uses the ERC-20 standard. Rune coin is used to pay for goods and services on the RuneScape platform.
**Recent news**
In September 2023, RuneScape announced that it would be partnering with cryptocurrency exchange Binance to launch a new NFT marketplace. The marketplace will allow users to buy and sell NFTs of RuneScape items, such as armor, weapons, and pets.
**Disclaimer**
I am not a financial advisor and this is not financial advice. Please do your own research before investing in any cryptocurrency.
**Additionally**
Rune coin is a volatile asset and its price can fluctuate wildly. It is important to understand the risks involved before investing in any cryptocurrency.

RUNE bouncing on supportRUNE starting to print bullish market structure.
Also seems to be bouncing on this TL.
Waiting for a retrace from the market to enter a long soon.

RUNEUSDT my entry on this trade idea is taken from a point of interest below an inducement.. I extended my stoploss area to cover for the whole swing as price can target the liquidity there before going as i anticipate... just a trade idea, not financial advise


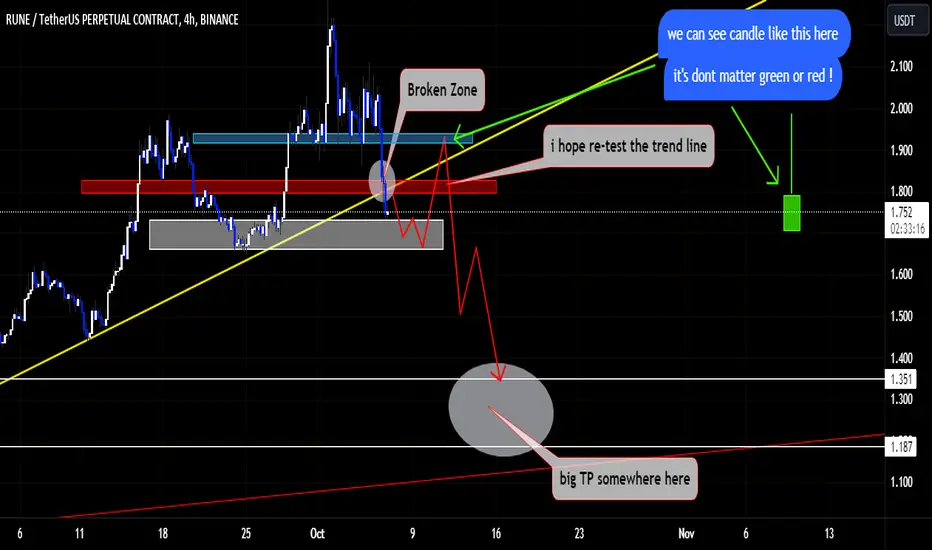
#RUNEUSDT.P - LAST PART OF THE GAME !!Hello friends!
In #RUNEUSDT.P, which I have been following for about 15 days, we have had two-three good profitable positions. Now we are on the road for the last big blow :)
I'm busy finding the right spot for our big strike position. And of course the shortest stop, the farthest target point.
When we look at the chart, I expect a re-test move from the current price zone, namely the 1,750-1,650 range. Although it is difficult to cut the return point in this re-test move, it is very likely that it will make a fake rise to the 1.90 region and show itself as if it has thrown itself into the uptrend again (Trap). However, in the 1.82-1.85 band, I no longer intend to get off the train until the 1.40 band, if not until the 1.15-1.20 levels, by joining the downtrend train. I hope it will happen as I expect and good earnings will be made.
Good Luck!
None of my statements do not constitute investment advice!!!
Translated with www.DeepL.com (free version)
RUNE potential long, strong support at 1.468RUNE potential long, strong support at 1.468 targeting 1.623 resistance level

Ready for RUn It's brake the triangle In top and ready for big long position 💪🏽
And offcourse again by my experience i take it makes sense

RUNE SHOR TERMThis is the path the RUNE can take for the upside retracement then eventually reject back down.


Rune currency will rise?In 4 hours, a structural failure is observed
which has also made a correction but has not yet reached the block order level
A pin bar candle has been formed in one day time, which can be promising
It can have a drop to our entry point, which is an important support level, and pull up from this area
This transaction will be risky
Be sure to check the amount of invested capital

RUNE/USDT Scalp Chart AnalysisCRYPTOCAP:RUNE Technical Analysis
#RUNE is attempting to break past key resistance at $1.70
If this level is cleared, we could see a move towards $2 next
But rejection here would put $1.60 back to the test
Always wait for confirmation before entering any trades!
Let me know your thoughts on #RUNE below.
But remember to trade responsibly, have a plan, and never gamble with money you can't afford to lose. Patience and discipline are keys.

Hello Rune - What's next ?I think you're tired now, it's time to rest a bit. I will take a short with a 4-hour close below the middle band and falling support.

RUNEUSDTBINANCE:RUNEUSDT
I missed the entry point for the short position, but it is possible for the price to return to that point
⚠️Note:
In this type of signals, only the entry point and trade direction are specified, and stop loss and target are not determined.
If you are interested in entering these signals, please provide a stop loss and a logical market-based target.
⛔"Daily crypto market analyses I provide are personal opinions & not financial advice. Trading carries risks, so do your own research & seek advisor's help.#DYOR"
Don't forget to like and comment

Rune Sell Trade For Short Term. Welcome to our crypto exploration hub! We're here to navigate the exciting world of digital assets, providing you with comprehensive insights into market dynamics and potential trading opportunities.Our mission is to decode the crypto market's mysteries and equip you with the knowledge you need to make informed investment choices. From the latest developments in Bitcoin to the hidden potential of various altcoins, we're your trusted source for daily technical analysis.While technical analysis is a valuable tool, it's important to remember that it's just one piece of the puzzle. We encourage you to take a well-rounded approach to your investments, considering factors like macroeconomic trends, news, and community sentiment.Join us for the freshest analyses, and don't hesitate to join the conversation in the comments below. Keep in mind that our content is purely for educational purposes and should not be construed as financial advice. Always integrate it into your broader investment strategy."

RUNE/USDT LONGI think we have found a local bottom after the last sell off, coming into the bottom of the channel. I am long targeting $2.

Rune starting the wave 5 ?Opening a long position on RUNE. Wave 4 is probably completed.
Starting a last wave (5) to the upside before retracement.
R&R is optimal
Let's goooo

BEARING CONTINUATION ON RUNEUSDTRune coin has been trending up for some time being until it hit a resistant key level and rejected the level. Price came down to the previous Resistance turning Support and broke through. Made a restest and finally gave out a pin bar candlestick indicating a bearish continuation.
This is not a financial advice, seek analysis before entry...

RUNE/USD - Great Run, Now PullbackRUNE had a great run after its lending mechanism went live.
However, the price has hit a major resistance at $2.2 and it's unlikely the price will push higher at this time.
Momentum indicators are also turning a bit bearish after such a rally. So expect a pullback.
The area at $1.3 looks interesting for buyers.
Bias a bit bearish in the short term.
Like and follow for more updates!

rune usdtrune usdt 4H
long
good risk/reward
always remember that positions with good risk reward has more chance to get stop loss.
take it by your own risk

RUNEUSDTHello snipers, nothing is impossible. We see that according to the previous analysis, the price has decreased and reached the set goals. A good position has been created and there is a possibility to change the trend and increase the price, but if it falls below the black line 1, the price will decrease to the black line 2.

RUNEUSDT POSSIBLE BULLISH SCENARIORUNEUSDT POSSIBLE BULLISH SCENARIO
If the daily close is above the grey zone and RSI crossed the red SMA line and broke the black trendline ,wait for a pullback and enter long .
Invalid on chart
Good LUck
