Either Long or Short, something will occur very soon.With no insider information the only thing I can say is, volume has increased in the last three days, Vol/ MarketCap shows a big ratio ( the farther from 0, the higher liquidity in the asset), liquidity = movement. Closing 4 hr candle showed a strong reaction, leaving a wick on the bottom.
RUNEUSDT trade ideas

Unlocking Next Move. Grab the Bull by the Horn**THORChain (RUNE)** is a decentralized cross-chain liquidity network that enables the permissionless exchange of native assets across different blockchains. RUNE is the native token of the THORChain network and is used to secure the network, incentivize liquidity providers, and pay transaction fees.
**Fundamental Analysis**
THORChain is a unique project in the cryptocurrency space because it allows users to exchange native assets across different blockchains without having to rely on a centralized exchange. This is a major advantage, as it eliminates the risk of counterparty trust and allows users to trade their assets directly with each other.
THORChain is also a very secure platform. The network is secured by a bonded proof-of-stake (BPoS) consensus mechanism, which is designed to be highly resistant to attack.
**Recent News**
On September 26, 2023, THORChain announced that it had partnered with Metap Inc., a leading provider of digital asset custody solutions. This partnership will allow THORChain to offer its users a secure and compliant way to store their digital assets.
On September 22, 2023, THORChain announced that it had been selected by the World Economic Forum to participate in its Blockchain for Social Impact initiative. This initiative aims to use blockchain technology to solve some of the world's most pressing social problems.
**Conclusion**
THORChain is a promising project with a strong fundamental value proposition. The network is secure, scalable, and solves a real-world problem. However, it is important to note that the cryptocurrency market is volatile and prices can fluctuate wildly. It is important to do your own research before investing in any cryptocurrency.
RUNEUSDTHello, as you can see, an ascending wedge is in a downward trend, in case of failure, it can fall to 1.40 or 1.36.
Breaking the support of 1.86 starts to fall

RUNE/USDT Crucial Moment. Continue Upward or Broke the Support ?💎 RUNE is on our radar due to its significant movements. Currently, it's hovering in a pivotal zone that previously acted as daily resistance but now serves as support. At present, RUNE is in a retesting phase, with the candlestick patterns indicating several bullish rejections.
💎 This suggests that RUNE might be gearing up for an upward trajectory, possibly targeting the Bearish OB zone. Additionally, there's an FVG Area that RUNE might interact with.
💎 However, if RUNE struggles to maintain its position above this support and breaks below, there's a chance it could descend to the demand zone. Here, it might either exhibit a rejection or initiate a new upward leg. If it continues its downward trend, it might even reach the Strong Demand area.


#RUNEUSDT.P IDEACRYPTOCAP:RUNE break the rising wedge and in M15 price coming to test the trendline and resistance zone at 1.96. H4 RSI crossover the MA and currently in overbought zone.
Im looking for a SHORT on this resistance zone.
ENTRY: 1.96 - 1.98
SL: 2.04
TP1: 1.863
TP2: 1.824
TP3: 1.766
Not a financial advice, DYOR

RUNE on the way to 2.5 as plan!2h time frame
According to our previous analysis about RUNE, this Cup and Handle is doing well so far.
Here is the best timing to set protective stop to avoid unrealized profit gone.
Adjust SL from 1.414 to 1.95
Previous post as below.

RUNEUSDT - Buy SetupRUNEUSDT (1D Chart) Technical analysis
RUNEUSDT (1D Chart) Currently trading at $1.959
Buy level: Above $1.95
Stop loss: Below $1.55
TP1: $2.2
TP2: $3
TP3: $4
TP4: $5
Max Leverage 2x
Always keep Stop loss
Follow Our Tradingview Account for More Technical Analysis Updates, | Like, Share and Comment Your thoughts

RuneUSDTwith the 4H time frame
I made an idea of two trades with the both sides Long and short
For the long position: the price broke the resistance (yellow line) so I would risk to buy Rune from this level with risk 2/1
For the short position: If the price hit the resistance we have ( white line) as u see in the screen it can be good price to make short position from it
This is not a financial advice
if u like the ideas I'm sharing with u. Please follow me

runeusdtHello friends. nothing is impossible. We see that on the daily time frame, the price is above the 103-day moving average. The overall trend is up, but the price has reached a strong resistance level.

$RUNE possible 5th wave extended. CRYPTOCAP:RUNE possible 5th wave extended.
possible targets for RUNE are $2.4 normal 5th wave, and $3.6 for an extended 5th wave.

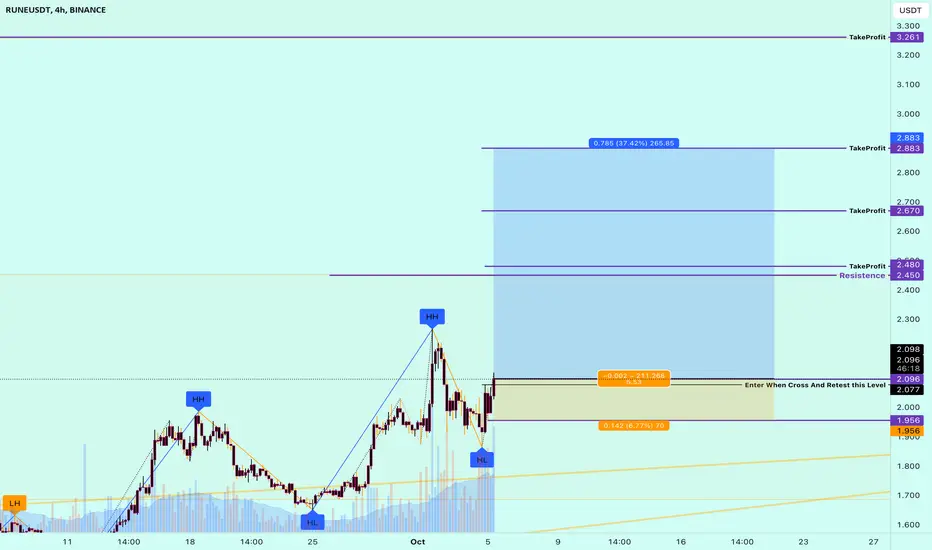
RUNE retesting resistanceRUNE UPDATE: RUNE at daily bearish OB again…. RUNE need to break above 2.077 on daily TF for bullish continuation and if it get rejected here again, we might need to revisit 1.649 for daily support again…. Those red price above are the take profit zones if we flip daily resistance as support ok daily timeframe…. I might look for short here if I see any change of character on 15mins timeframe….. stay safe
Chat me up me if you want trade setup for profit outcome and follow for more trading analysis

RUNE Cup and Handle target 2.52h time frame
-
RUNE is creating a potential cup and handle srtucture, also in the phase of continuation structure, which pumping wave is 0.905 ~ 2.028. Critical resistance is obvious at 1.973, if RUNE can break above it then we can have higher target based on the cup and handle structure.
TP: 2.493~2.665
SL: 1.414

#RUNEUSDT.P - RETRACEMENT TIME !If we look at the daily chart we can see very clear Bullish Flag. But when when we look at the low time frame, it must make a retracement. Because of that; my idea #RUNEUSDT.P will make a correction for go more higher !
You can see my targets on the chart !
It's not an investment advice !!

Rune Sell EntryWelcome to our crypto exploration hub! We're here to navigate the exciting world of digital assets, providing you with comprehensive insights into market dynamics and potential trading opportunities.Our mission is to decode the crypto market's mysteries and equip you with the knowledge you need to make informed investment choices. From the latest developments in Bitcoin to the hidden potential of various altcoins, we're your trusted source for daily technical analysis.While technical analysis is a valuable tool, it's important to remember that it's just one piece of the puzzle. We encourage you to take a well-rounded approach to your investments, considering factors like macroeconomic trends, news, and community sentiment.Join us for the freshest analyses, and don't hesitate to join the conversation in the comments below. Keep in mind that our content is purely for educational purposes and should not be construed as financial advice. Always integrate it into your broader investment strategy."

Falling Wedge, wait for breakoutChart 1H TF
I figured out a reversal pattern, Falling Wedge.
This pattern combines with Support zone around 1.7 that is very good for reversal.
So wait for a signal to confirm this pattern

Rising Wedge or Diagonal Wave | Short BiasChart 4H TF
I figure out a Diagonal Wave might be done around 2 or little higher
RUNE has Resistance by Previous High around 2 and Support by Ascending Trend Line
If my analysis is true, I expect RUNE will come back to 1.72 then up and down awhile
So wait and see what happen

RUNE Trend End🔆#RUNE Analysis : TREND END ⛔️⛔️
As we can see that #RUNE was in uptrend but there is a bearish diversion in RSI so there is no more uptrend and there are two support zone. This may come back into trend after retest the support zone.📈📈
🔖 Current Price: $1.722
⏳️ Target Price: $1.390
⁉️ What to do?
- According to the chart it will go down to 1.400. Keep your eyes on the chart, observe trading volume and stay accustom to market moves.🚀💸
🏷Remember, the crypto market is dynamic in nature and changes rapidly, so always use stop loss and take proper knowledge before investments.
#RUNEAnalysis #Cryptocurrency #TrendEnd #DYOR

RUNEUSDTRUNEUSDT just enter into the bearish trend.
Bearish divergence also shown in RSI.
Printing LH and LL.
This indicates trend is going down.
We wait and watch for the breakout of last LL.

RUNE 2 countsYellow count represents wishfull thinking. IT would look like an absolute beast of an impulse.
THen we could prepare for the potential pullback and set our longs.
Red count would be more realistic.
While red ii took time to correct, wave iv was just a consolidation.
Cant be sure of the actual count so i provide both...
Will update
If this analysis helped you, dont hesitate to support my work. Thank you :)

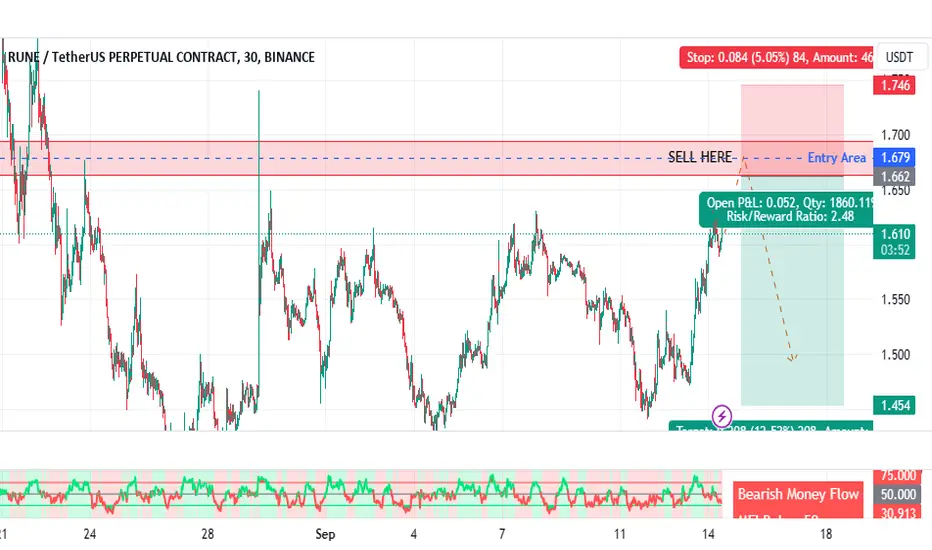
Rune Futures | Possible Short Position In my opinion, the recent rises are nothing but a new correction wave and the forced removal of old bears from the system to make room for new bears.
A Short position should work perfect if we could reach the area between 1.7 & 1.8
And we can book some profits starting from 1.555
RUNE/USDT probably +12%?I saw a lot of buying pressure in the past few days, and the trend still appears to be bullish.
Order Book also shows that there are a lot of long orders where the green box is, and very less sell orders. I don’t think that we will go past the TP3, but like I said there aren’t many sell orders, so the trend might continue.
RSI is also looking great, and I expect RUNE to go up even more in the upcoming days.
If you decide to open a position I don’t recommend doing it on Futures because the market has been very volatile.

Triangle Breakout Signals Bullish Momentum for RUNEUSDT💎 Since its low in June, #RUNEUSDT has demonstrated impressive strength, boasting a remarkable 140% price surge. This performance places it among the top performers in recent times. Notably, the price journey broke free from a descending channel, catapulting from $1 to the psychological resistance at $2.
💎 Following this substantial upward move, a consolidation phase ensued. During this period, #RUNE established robust support at $1.385, corresponding to the 38.2% Fibonacci retracement level. Within the confines of this consolidation, a triangle pattern took shape. Recently, #RUNE decisively breached the upper boundary of this triangle, signaling a robust bullish sentiment.
💎 Simultaneously, the breakout extended beyond the confines of the previous descending channel. This demonstrated a compelling surge in buying pressure. As a result, it's reasonable to assume that the overall trend remains bullish. According to Elliott Wave theory, there appears to be potential for at least one more upward wave.
💎 Evaluating the factors at play, including the strength of the preceding uptrend, the presence of trendline resistance, and the 161.8% Fibonacci retracement level, we can anticipate #RUNE's next move. There is a high probability of #RUNEUSDT aiming for the $2.434 resistance area in the near future.
💎 Nevertheless, Paradisers, it's essential to remain prepared for potential range-trading and even short-term pullbacks before the uptrend fully resumes. Given the recent pace of growth, any uptrend resumption is likely to be relatively swift.
