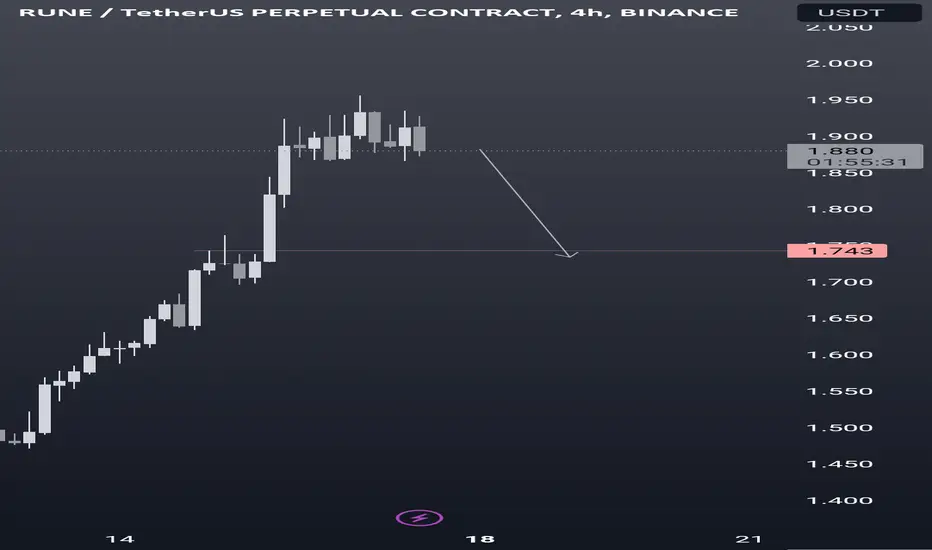
Rune analysis Rune should dump
POI on Daily timeframe is 1.743..losing 1.743 level on weekly chart and next target for Rune will be 1.588..
*Daily POI is 1.743
*4h POI 1.717
RUNEUSDT trade ideas
Rune/Usdt Short Rune 4h frame Bat Harmonic
Entry 1 : 1.936
Entry 2 : 1.974
Target 1 : 1.764 (9.70% )
Target 2 : 1.699 (13.12 % )
Target 3 1.634 (16.40% )
Stop loss : 2.052 (-5%)

RUNEUSDT → A retest of resistance could break the line BINANCE:RUNEUSDT gives us new prerequisites for further strengthening of the price. Another resistance retest is forming, which can break this zone on the background of local BINANCE:BTCUSD growth
Several key elements are marked on the chart. The descending wedge, resistance retest, pre-breakout consolidation - all this can be regarded as a complex signal for a breakout of resistance. On the background of bitcoin's local strengthening, which occurs after breaking out of resistance, this could date a chance for RUNE and in such a case, the price when breaking through the indicated line could head towards 3.04 and give us almost 60% net move.
The moving averages formed a strong signal a few days ago, which could be confirmed soon when the price breaks the upper boundary of the range
Support levels: 1.722, 1.433
Resistance levels: upper boundary of the wedge, 1.942, 2.015.
I expect that on the background of the next retest of the trend resistance the price may break it and start an active phase of strengthening towards 3.040
Regards R. Linda!

Breakout by Breakout | Long BiasWeekly Chart
Wait a breakout and close above 1.9 that's confirm for next bullish up to 3.1
Chart 4H TF
RUNE is trading around 1.82x it closed above 1.72 and moving up to 2
RUNE can go up and down in range 1.7 - 2 awhile before breakout, so this time for collect part by part.
Time will tell

#RUNE/USDT 1D (ByBit) Descending trendline fakeoutTHOR Chain is about to print an evening star deviation and RSI looks overbought, seems likely to retrace down to 200MA support.
⚡️⚡️ #RUNE/USDT ⚡️⚡️
Exchanges: ByBit USDT
Signal Type: Regular (Short)
Leverage: Isolated (3.2X)
Amount: 5.0%
Current Price:
1.649
Entry Targets:
1) 1.727
Take-Profit Targets:
1) 1.292
Stop Targets:
1) 1.945
Published By: @Zblaba
CRYPTOCAP:RUNE #RUNEUSDT #ThorChain #DeFi
Risk/Reward= 1:2
Expected Profit= +80.6%
Possible Loss= -40.4%
Estimated Gaintime= 4-6 weeks
thorchain.org

#RUNUSDT IDEACRYPTOCAP:RUNE is on the strong resistance, im looking for a SHORT now
ENTRY: 1.591 - 1.619
SL: 1.663
Tp;
1). 1.510
2). 1.445
3). 1.375
RR: 1:3

💡Trade Idea #RUNE/USDT:Some of you asked me to analyze t#RUNE. Here you go, this is what I see. This #cryptocoin has a huge percentage movement. Use smaller leverage if you are going with this one.

Brief Analysis——RUNEThere was a significant increase in RUNE some time ago, with the price rising from 0.92 to 2, almost doubling. The current price remains fluctuating above 1.4. Let’s make a brief analysis on RUNE today.
At the daily level, you can find that RUNE has been volatile after its rise in early August, and the price seems to start a new round of rise at a certain point.
However, judging from the signals given by the WTA indicator, whales participated in the initial rise, but gradually decreased during the subsequent fluctuation, until retail investors contributed all participation. This is not a good phenomenon. Continued fluctuation may mean that whales are continuing to take profits and close the position.
Switching to the 4h level, we can see that the whales have shown signs of reduction during the previous rise. In the green box, the giant whale seems to disappear all of a sudden. Although the RUNE remain rising, the whale has begun to take profits here. During the subsequent fluctuation, the number of whales was low.
What the WTA indicator reflected in the two cycles tells us that the whale has taken profits after raising the price. The rise may be coming to an end.
Disclaimer: Nothing in the script constitutes investment advice. The script objectively expounded the market situation and should not be construed as an offer to sell or an invitation to buy any cryptocurrencies.
Any decisions made based on the information contained in the script are your sole responsibility. Any investments made or to be made shall be with your independent analyses based on your financial situation and objectives.

RUNE/USDT 4H - Extension Breakout SHORTI've been looking at RUNE, After being able to set what seems to be a pretty good range, I'm going to wait for that Fibonacci extension to see how to price reacts at that zone.
-We have a juicy node that matches that 4h level
-Breakout seems playing well, currently looking for support trendline after breaks
-Waiting for the same reaction in BTC, that might be delayed
*Could be.. retest of the POC to jump to that 4h level.

THORCHAIN RUNE: Is It Going to Dump Hard?BINANCE:RUNEUSDT has been on my watchlist for a while, and based on this analysis, I have a bearish sentiment on RUNE.
Let us see how this will play out in the next couple of days.
What are your thoughts about this analysis? Share them with me in the comment box.
If this analysis makes sense to you, follow me now and support my idea.
Cheers!

Runeusdt.p Thorchain H1 Sell SETUPI see a classic smc model sale in the runeusdt pair, it may be reasonable to analyse extra yourself and enter the appropriate place for entry or enter from here

ThorChain - RUNEUSDT.PAs you can see in the chart, we see an insane rise, but I think this rise is now over, I share the analysis in the daily time frame, but I will share the H4-H1 images from it, you can make your own analysis and take action, your priority is to use stop, strong needles can flake your money.

RUNE SHORTBINANCE:RUNEUSDT SHORT. Rejected by range highs again. There’s also a bearish divergence on 4h. Shorting range highs has worked out for me 4 times in the last 2 weeks. Let’s see if i’ll get lucky again!

RUNE REVERSAL A reversal in the making .
reasons to take the trade reversal for long:
1)Uptrending
2)doji at 4H time frame + increase in volume
3) close to support at 1.368

Reversal Pattern, chance to buyChart 4H TF
BINANCE:RUNEUSDT has broken up and gone up to resistance zone around 1.62
Chart 1H TF
It's broken down ascending trend line and trading at 1.58x now.
I figured out some good signals for reversal
- Reversal Pattern: Head Shoulders
- ChOCh at 1.57
- Strong Resistance Zone around 1.6x
- Fake Breakout
So I expect price will down to support zones at 1.56, lower 1.52
Wait and see what happen

RUNEUSD ❕ divergenceRUNE has fixed under 50EMA on 1H TF.
Price and RSI chart formed a divergence (1H and 30m TFs)
I believe that the asset will continue to decline.

Rune shortshort thought for final cleaning to go up. I think we are in wave 4. this means preparation for 5

Rune/Usdt LONGCandle Breaks Triangle, After Breakout in 4h Time Frame … Waiting for Pullback to get Entry!

RUNE Cooling OFF!The short term oscillators are pretty heated and in peaks on their wave formations. Stochastic RSI and RSI is starting to crest loosing momentum. I expect a move down to retest $1.50. The $1.60 area is looking like a strong resistance. This is not a long term setup!
Stop Loss: $1.575
Profit level 1: $1.50
Profit level 2: $1.42
Profit level 3: $1.38
Much peace, love health, and wealth!

RUNE ANALYSIS (1D)The upward movement we had was for a diametric of the daily degree. Considering the resistance that is in the way of the price and the diametric channeling, it seems that this upward movement is over. We expect downward movements at least to the green zone from RUNE.

RUNEUSDT LONGCUP & HANDLE PATTERN,Keep any eye once its break the handle it will pump hardly.so take trade with low leverage because market is very choppy.

[Altcoin] RUNE Perspective - Weekly Timeframe - September 4, 202Context: After breaking out in a Falling Wedge Reversal (FWR) pattern, the price is currently in the process of back-testing a new support area (break-out area around 1.19x). It's also pulling back towards the EMA-20 line, forming a Decrease Triangle Reversal (DTR) pattern. This week's closing candle is a shooting star with a long upper shadow and a small body.
Trendline / EMA: The price is following the DTR pattern in the current price range to retest the FWR pattern, with the Trendline back-test approximately 20% away and EMA about 10%. Additionally, the price is forming a temporary support around 1.3x, which is providing some stability.
RSI / MACD / MFI: These three indicators are showing a declining trend, having formed peaks and moved sideways while the price is retracing. However, they still remain relatively bullish.
Analysis: After more than a year of sideways movement (from May 2022 to August 2023) within the Falling Wedge pattern, the price has finally broken out. Based on the current technical indicators, the likelihood of an upward trend persisting is high. However, from the current price range, there is still a possibility of a further 10-20% decline before resuming an upward trajectory.

RUNEUSDT 12H#RUNE is completing the Descending Triangle. If it breaks the support, $0.15 in on the table.
