RUNE longRUNE broke through the resistance level. The bullish movement to the resistance level at $2.41 is expected to happen next
RUNEUSDT trade ideas

THORChain Bullish Confirmed: 361% Back To Baseline PotentialWhen a Cryptocurrency trading pair moves and closes daily above EMA13, this confirms a bullish bias. The longer the moving average the stronger the signal/confirmation.
Here we are looking at RUNEUSDT (THORChain) and we can see a move and close above EMA13 and EMA21. The move above EMA21 happened today and this one is confirmed only when the session (daily candle) closes above this level.
EMA13 is a short-term exponential moving average when it comes to Cryptocurrency trading charts. A move above this level signals the change of a bearish bias towards a bullish one.
The fact that RUNEUSDT is moving also above EMA21 fully confirms the short-term bullish signal given by the break above EMA13. In simple terms, we are going up —bullish confirmed.
When there is a strong drop, as shown in this chart, there is always a counter move "back to baseline." The baseline here is the last high because of a double-top between May and December 2024.
Back to baseline would give us a minimum of 361% potential for growth. This is short-term. There is sure to be more, much more because we are in a bull-market year. Prepare for massive growth. This is an easy chart, an easy trade.
Thank you for reading.
Your continued support is highly appreciated.
Namaste.

Rune long to $1.65Just opened a long trade on Rune. I anticipate that it will have a big breakout tonight.
Roughly 6RR trade.
Time sensitive.

Rune short back to $1.252I just now setup a limit order to short rune/usdt.
Limit entry: $1.371
Stop: $1.432
Roughly 2RR setup.
Going to bed now.
Just a simple retest continuation trade.

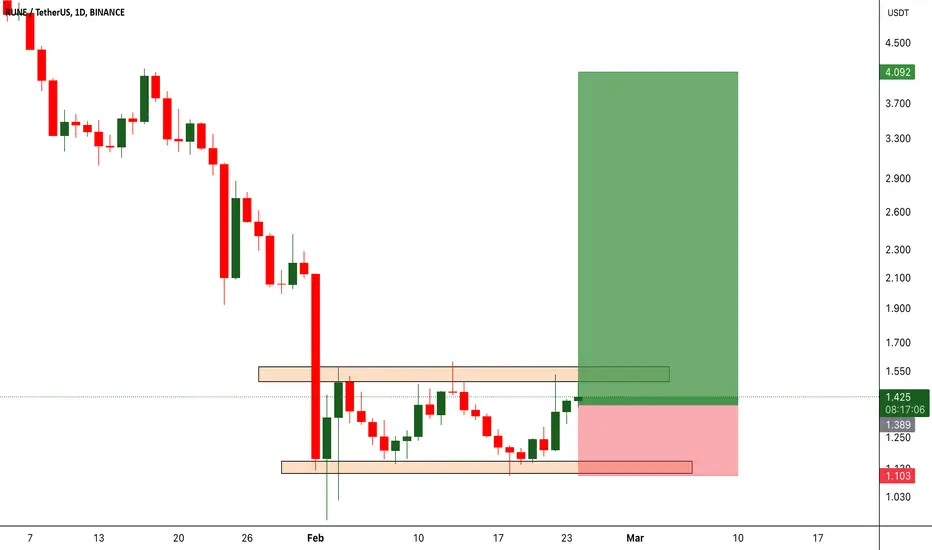
RUNEUSDT: The Unstoppable Breakout? Eyes on the Resistance!BINANCE:RUNEUSDT has been showing remarkable strength while the broader market struggles, repeatedly holding support and now pushing towards a key resistance level. This consolidation phase suggests a potential explosive move ahead. A breakout above this major resistance could trigger strong bullish momentum, making BINANCE:RUNEUSDT unstoppable in the short term. Volume confirmation will be crucial, as increasing buying pressure could validate the breakout and fuel further gains. However, risk management is essential false breakouts are always a possibility, so setting a stop loss just below recent support levels is key to protecting capital. All eyes are now on the breakout level. if BINANCE:RUNEUSDT clears it with conviction, it could be a high-potential trading opportunity. Trade smart, stay disciplined, and always keep your stop loss in place.
BINANCE:RUNEUSDT Currently trading at $1.41
Buy level: Above $1.4
Stop loss: Below $1.1
Target : $4
Max Leverage 3x
Always keep Stop loss
Follow Our Tradingview Account for More Technical Analysis Updates, | Like, Share and Comment Your thoughts
RUNEUSDT Strong Support Zone – 300%-400% Gains Potential!RUNEUSDT is currently trading at a strong support level, which presents a significant opportunity for potential upside. Support levels act as critical price points where demand is expected to be strong enough to prevent further declines. The fact that RUNEUSDT is holding well at this support level suggests that the price may reverse course and initiate a rally. With solid volume backing this level, there is a good chance that RUNEUSDT could see substantial gains in the coming weeks, with projections of 300% to 400%+ if the price rebounds and continues to surge from here.
The support level is crucial as it indicates that buyers are stepping in and absorbing the selling pressure, preventing the price from breaking lower. The good volume accompanying this consolidation adds to the strength of this support zone, making it more likely that RUNEUSDT will bounce higher once it consolidates further. The growing investor interest suggests that traders are starting to recognize the potential in this project, which could trigger a wave of buying pressure once the price moves past key resistance levels. With the projected gains of 300% to 400%+, this makes RUNEUSDT an asset to keep an eye on for those looking to capitalize on potential explosive moves.
RUNEUSDT's position at the strong support level also indicates that the current downtrend might be coming to an end. If the price successfully breaks above the resistance level that has formed after the support zone, it could signal the beginning of a significant upward trend. This is supported by the increasing investor interest in the project, which further suggests that market sentiment is turning positive. If the price rebounds and gains momentum, the target of 300% to 400%+ is within reach, making this an exciting setup for traders looking for high-reward opportunities.
Investors should keep a close watch on RUNEUSDT as it holds at this critical support level. A successful bounce off this level, combined with strong volume and buying interest, could signal the start of a major rally. With the potential for significant returns and an improving market sentiment around this crypto pair, RUNEUSDT presents a promising opportunity for those seeking high-potential trades in the market.
✅ Show your support by hitting the like button and
✅ Leaving a comment below!
Your feedback and engagement keep me inspired to share more insightful market analysis with you!

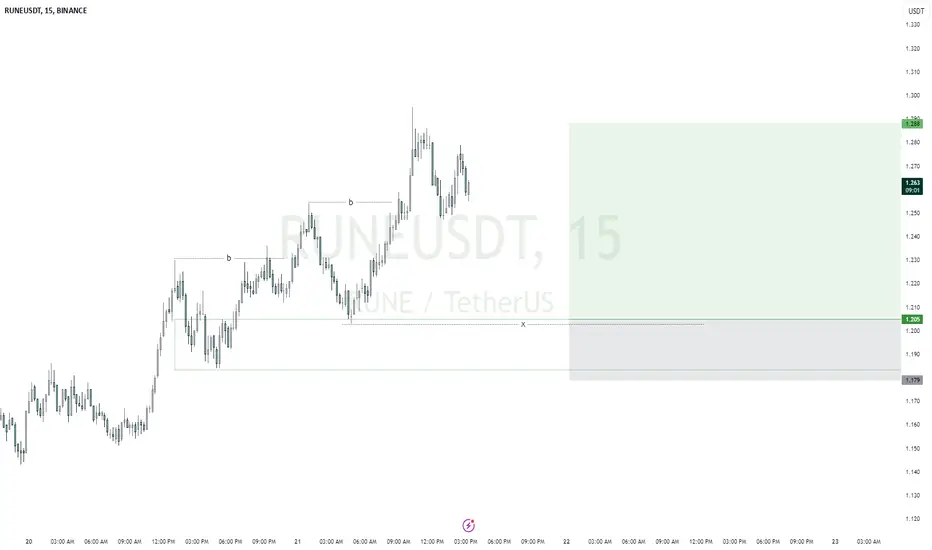
RUNEUSDTmy entry on this trade idea is taken from a point of interest below an inducement (X).. I extended my stoploss area to cover for the whole swing as price can target the liquidity there before going as I anticipate.. just a trade idea, not financial advise
Entry; $1.205
Take Profit; $1.288
Stop Loss; $1.179
Rune /usdt The currency will witness a significant rise on the weekly interval because it has reached oversold levels and is now below its fair price. The bullish wave is targeting record numbers.

Rune started to overcome 1.60 resistanceAfter 1.60 resistance a big jump starts towards 3 $...wow after that maybe more and more....

Rune .... Will it be rescue from the downward trend ?S.O S needed indeed for Rune ...
Will it be another luna?
Will that completly ended like #perlin ?

Will be Rune considered as Skam ProjectEvery project in crypto market is trying to solve a problem ,if any project affected by Bitcoin ! And loss its value by decreasing price of Btc! So what would be the projects value for??? will Rune overcome this issue?

RUNEUSDTHi there fellow traders, As long as we stay Above the Trendline it will be ok.
As we had Major Turbulence down.
However Due to BTC Movement if we lose 90k BTC we could see RUNE hit even lower as in proper Worse case scenario Ideal price for Recovery would 0.681 - SL hunt
As Aways Do your Own Analysis Before Buying
Trade Responsibly

$RUNE time to Buy !!!!!!In the weekly RSI, we can see the green line crossing above the red line, indicating an uptrend. This is a strong buy signal, and I highly recommend considering a purchase!

Trading with Trendlines: Shorting Touches & Longing Breakouts📉 Using Trendlines for Trading Opportunities 📈
Trendlines are one of the simplest yet most powerful tools in technical analysis. A well-drawn trendline can act as dynamic resistance or support, helping traders identify short and long opportunities.
How to Trade with Trendlines
🔻 Shorting the Trendline Touches
If an asset is in a downtrend, draw a yellow trendline by connecting the lower highs.
Every time the price touches the yellow trendline, it’s a potential shorting opportunity.
Take profit near the local support or recent swing low.
Stop-loss should be placed slightly above the trendline to avoid fakeouts.
🔺 Longing the Breakout
If the price breaks above the yellow trendline with strong momentum, it may signal a trend reversal.
Look for confirmation (high volume, retest of the trendline as support).
Enter a long position and set targets at key resistance levels.
Place a stop-loss below the breakout point in case of a fakeout.
Example Chart Setup
Yellow line = Downtrend resistance trendline.
Short Entries = Price rejection at the trendline.
Breakout Long Entry = Once the price closes above the trendline with volume confirmation.
🚀 This strategy works best when combined with other indicators like RSI, moving averages, or volume analysis.

BUY SPOT RUNEUSDT (Short-Term D1 Cycle)🚀 BUY SPOT RUNEUSDT (Short-Term D1 Cycle)
📢 RUNEUSDT is setting up for a quick 70% gain opportunity!
📌 Trade Setup & Market Outlook
✔ Short-term spot trade based on the D1 cycle.
✔ Aiming for a 70% upside move within the next 1-2 days.
📌 Trade Plan:
Entry Point: $1.3 - $1.4.
Target: $2.2 (~70% gain).
Hold Time: 1-2 days.
💡 Key Considerations:
✔ Monitor volume & breakout confirmations before heavy accumulation.
✔ Use stop-loss strategies to minimize risk.
✔ Secure profits as the target approaches.
🔥 RUNEUSDT is ready for a quick move – Time your entries wisely! 🚀

More hearth breaking dump for runeJust opened a short on RUNE to replace #toncoin short that just wicked me out.
This token been selling off like crazy for weeks now and I don't think its over just yet.
I plan to average out along the way.
It came close to a weekly support area around $0.936 but haven't tested it yet. It might do so today if btc starts to dump again which I think is likely.

RUNEUSDTRUNE ~ 1W Analysis
#RUNE Buy gradually from here if you still have a Conviction on this Coin with a minimum target of 20%+.

RUNE/USDT – Oh man... maybe up :)?The RUNE/USDT pair has seen a significant drop recently. That was sad.
Despite the decline, the MACD indicator is showing a bullish divergence, which could signal a reversal.
Main support and breakout zone to further decline is at 0.94 and possible take-profit zone around 1.95. I am hoping to reach 1.95 in this, maybe next week. What will happen next? Bitcoin will tell us.
Things look promising because of low activity in price action recently... something is about to happen.

Very good chart RUNERune
It has a chart similar to Floki and can climb from that area to the specified gap area
You can use 5 to 7 leverage in this transaction

RUNE/USDT DAYTRADE VOLUMERUNE/USDT DAYTRADE VOLUME
It can start a new uptrend volume in the coming hours

THORChain Convert Debt into Equity: What about RUNE Holders FateTHORChain ( CRYPTOCAP:RUNE ) has taken a bold step to address its $200 million debt crisis by converting unserviceable debt into equity through a new token, TCY (Thorchain Yield). This strategic move follows the suspension of THORFi services on January 23, 2025, due to financial instability. While this decision aims to stabilize the ecosystem, the market response has been mixed, with CRYPTOCAP:RUNE experiencing sharp volatility.
THORChain’s Debt-to-Equity Move
The newly introduced TCY token will be issued at a rate of 1 TCY per dollar of defaulted debt, effectively turning affected lenders and savers into equity holders. To further support this transition, THORChain plans to create a RUNE/TCY liquidity pool with an initial $500,000 backing, pricing TCY at $0.10 per token. Additionally, TCY holders will receive 10% of THORChain’s revenue indefinitely, providing a long-term recovery mechanism.
Despite these efforts, concerns linger regarding the timeline for full financial recovery. However, THORChain’s core functionality—cross-chain swaps—remains intact, ensuring continued utility for its users. Market sentiment, however, reflects uncertainty, as seen in CRYPTOCAP:RUNE ’s price action.
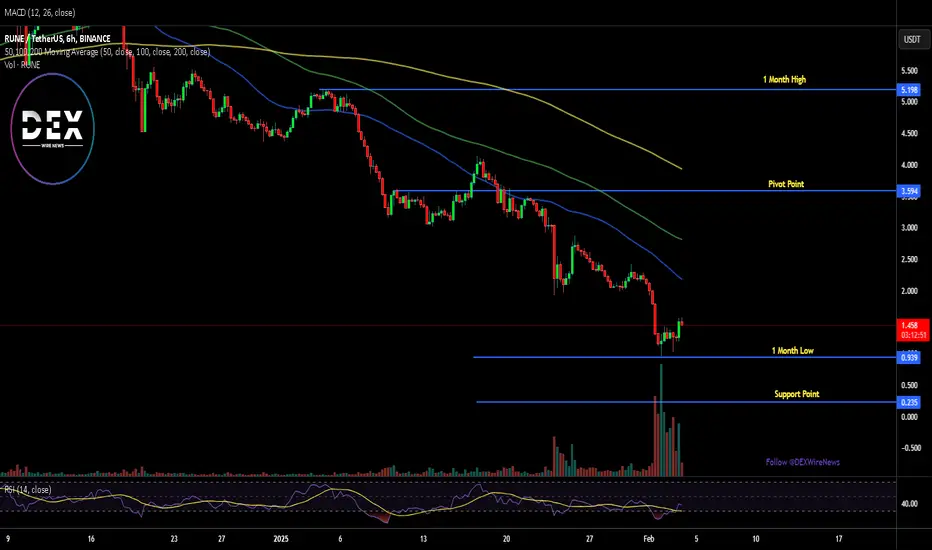
Technical Outlook: Can CRYPTOCAP:RUNE Recover?
Following the debt-to-equity announcement, CRYPTOCAP:RUNE has exhibited mixed performance. Initially, it plunged 10% within 24 hours, extending its 30-day decline to nearly 50%, in line with the broader market downturn. However, as of the latest data, CRYPTOCAP:RUNE is showing signs of recovery, posting an 11% gain and trading within a moderate zone.
Key Levels to Watch:
- Relative Strength Index (RSI): Currently at 38, indicating potential oversold conditions and a buying opportunity.
- 38.2% Fibonacci Retracement Level: The $3.58 price mark aligns with this critical resistance; a breakout above this level could fuel a bullish rally.
- 1-Month High Target: If momentum sustains, CRYPTOCAP:RUNE could push towards $5, the next major resistance level.
Conclusion
THORChain’s move to convert debt into equity is a double-edged sword. While it provides a structured approach to managing financial challenges, investor confidence remains uncertain. The success of the TCY token will heavily influence market sentiment around CRYPTOCAP:RUNE in the coming weeks.
As the market digests this pivotal restructuring, all eyes remain on CRYPTOCAP:RUNE ’s price action and the effectiveness of THORChain’s recovery strategy.

RUNEUSDT SELL ANALYSIS BEARISH PENNANT PATTERNHere on Runeusdt price form a bearish pennant pattern and now try to move down so if line 1.280 break price is likely to continue moving down and trader should go for short with expect profit target of 0.681 and 0.029 . Use money management
