RUNEUSDT
✅ ✅ Risk warning, disclaimer: the above is a personal market judgment and analysis based on published information and historical chart data on The trading view,
And only some of these analyzes are my actual real trades.
I hope Traders consider I am Not responsible for your trades and investment decision.
RUNEUSDT trade ideas

runeusdt downtrendAccording to supply and demand areas and trend lines, I expect a drop to the specified range.

RUNE Thorchain Long spot trade I think RUNE will make a big move...very soon. And It's gonna run fast when it breaks daily (and weekly trend). If market continue to explode RUNE will be one of the really fast movers. In this spot trade I wouldn't wait for the trendbreak. I think the risk reward ratios is good as it is 1.6. RUNE is lagging compare to many other coins and I think its high probability that RUNE is one of the next coins that makes a big move - non financial advice.

Timeline for the minor bull market (based on RUNE chart)RUNEUSDT chart gives a comprehensive outlook on when the current bear market can probably end and the interim (minor) bullmarket start.
I'm not speaking about the major bullmarket similar to 2020-2021, which obviously is determined by Bitcoin's halving cycles, but rather an interim smaller bullrun with lower highs, which are nevertheless enough to cause high retail demand and money flow.
The downtrend set by the highs of THORChain (Rune) intersects the 'projected' price of RUNE approximately in 6 months, forming a perfect double bottom. This is especially remarkable, since right now we are in an upthrust (bull trap, if we agree with this logic) which may lure many retailers in what they believe is a 'recovery', although it is not.
The fact the the line of the downtrend being projected further forms a second bottom mirroring the already formed one, made me think that this can be an indication of the end of the bear market (when the price breaks above the trendline).
Of course if you look at any other crypto chart, including BTC, you also will be able to see this ~160 day bottom we've gone through by now with a minor upthrust we're currently in, but RUNE is the first chart where I so a second visible confirmation in form of intersection between the end of the second bottom (not yet formed) and the projection of the trend line.

RUNE / USDT PO3 formationRUNE / USDT PO3 formation
If bitcoin truly formed this "local" bottom at 15k, then I expect something like this to happen

Rune SHORT TERM DIPShort this move down with 4x leverage. Bag yourself an easy 40% profit.
Stop at range high.

[Watch it] RUNE broke out. Notable potential upside (>2x)RUNE broke out and seems good to go on HTF, watch it.
TP #1 3$
TP #2 3,9$

RUNE SHORT SETUPHi, dear traders. how are you ? Today we have a viewpoint to SELL/SHORT the RUNE symbol.
For risk management, please don't forget stop loss and capital management
When we reach the first target, save some profit and then change the stop to entry
Comment if you have any questions
Thank You

RUNEUSDT IdeaMore of a creative idea with the assumptions of where the price will move with the placement of a bars pattern
On chart is also two channels, one down , one up.
There is also a large falling wedge highlighted in green

THORChain - RUNEusdt notes on chartLet me know what you think, currently this is what I am seeing (notes on chart).
Ranging for now - will play this either way it decides to go.
Cheers

Rune is a Rocket that is about to take off. DYOR on the Thorchain project but it is about to make some serious gains.
Seriously undervalued.

RuneusdtThis analysis is just my mental and personal idea
Please analyze before entering
Get approval first

RuneUsdt Close to 2GoldenCross2Golden Cross Can happen
Run moving on wedge and can be drop
but market is good for pumping projects
so btc not dump others coin can be move up
only should btc save position and not drop.
GL
EntryPoint:
1.478
Supports:
1.355
1.211
1.135
1.063
Resistance:
1.632
Targets:
1.862
2.204
2.731
3.053
3.586
MidTime:
4.843
6.001
7.880
HODL:
10.642
13.186
17.316
GL
we close to GoldenCross and MA20 Cross Ma100
this can pump more and going touch MA-200
2GOLDEN CROSS
Ma20 now Cross MA 100
And Close MA 50 Cross MA 100

RUNEUSDT | TRIANGLE BREAKOUTRUNE has been trading with in a symmetrical triangle.
The price has been converged.
Now the price has trading above the breakout of triangle.
The same zone is also a breakout zone.
The bulls need to hold the breakout zone.
Manage your trades accordingly.


Runeusdt - selling this coin because bulshit news..
price broke through the support level. (blue level).
On the retest, I will look for a opens short.
The main thing that the market would not turn around.
Graphically, everything is shouting for a short.
.
Here's the bullshit news for the real cryptans.
❗️Important information for EXPERIENC cryptans.
Many of you probably know that Trust Wallet (TWT) has chosen ThorCHAIN (RUNE) as their primary crosschain partner. Here's a repost of CZ (head of binans) tweeting about it: twitter.com
❗️Of course, ThorCHAIN doesn't have its own API and, in fact, Trust Wallet uses the ThorSWAP (THOR) API built on ThorCHAIN. Here is the official ThorSWAP tweet: twitter.com
❗️Please note the ThorSWAP logo and compare it to the partner logo listed on Trust Wallet swaps (swaps are only available on Android for now). This is exactly ThorSWAP, not ThorCHAIN...
If you like the idea, please "Like" it. This is the best "Thanks!" for the author 😊
P.S. Always do your own analysis before a trade. Put a stop loss. Fix profits in installments. Withdraw profits in fiat and please yourself and your
your friends.

RUNEUSDPrice broke and retested a significant zone, creating a bullish N wave formation. All three moving averages gave me two conformations and an entry signal.

Rune going to End of trend (wave 5) Wave 5 rule "end of trend"
- Anything at the end of the wave has a chance to fail.
- Wave 3 extends more than 261.8% of Wave 1 and Wave 4 retraces more than 38.2% of Wave 1 + Wave 3.
advice
- The last wave should only play 38.2% for safety. After that, you should wait for the end of the trend and then play on a down trend.

RUNE - Are your bags full ? RUNE Weekly here. (linear).
Clear bottoming pattern is forming and we're in the final stages of the WXY correction (finishing up the 5th wave of C of Y). I'm really excited about this chart and have been for sometime. The last time I added to my bags was around 1.19. If we make a new low, which is about 50/50 right now, I will add more without hesitation.
Once my FSS indicator prints a buy signal, I will also buy adding to my position. After 3 consecutive Sell signals on the 3D, I am anxiously awaiting for it to go green.

RUNE takes a plungeRune just broke out of a bear flag in a continuation of a downtrend. A retest of the hitherto support is possible before it takes the final plunge with a possibility of 40% shave of its price

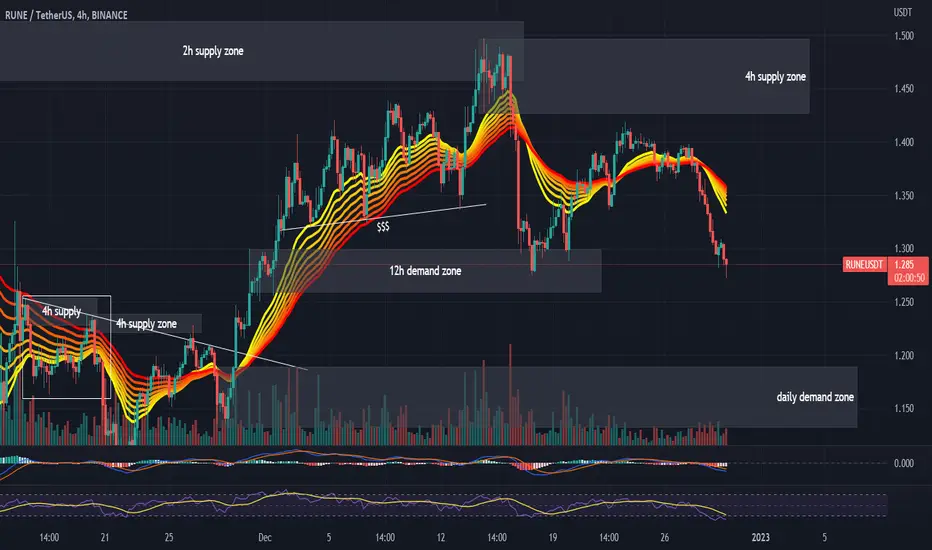
#RUNEUSDT 4H Chart
Price is still moving down after missing the 4h supply zone shortly. MACD is showing bearish weakness, RSI is oversold and EMAs are turning bearish. I expect price to keep moving down towards the daily demand zone at $1.18.
Rune will end wave 3 soonPrepare to short rune. you can play wave 4 and 5
"The risk is yours. manage it yourself"

RuneI told you that "Rune will be end wave 3 and make wave 4 on next step" on 10 Dec in my idea and now rune will make wave 4 and wave 5 step by step
