RUNE SHORT TRADE SETUPHello, dear traders. how are you ? Today we have a setup to SELL/longSHORT the RUNE symbol.
For risk management, please don't forget stop loss and capital management
RUNEUSDT trade ideas

RUNEUSDT #RUNEUSDT
MACD is showing bullish
EMAs showing a bullish move
RSI is neutral
in daily chart time we have realy important and strenght support zone was pushed the price up to 1200% in june 2021 and also we have falling wedge pattern that's give us signals for long position
targets set at the chart

RUNEUSDT#RUNEUSDT
in daily chart time we have realy important and strenght support zone was pushed the price up to 1200% in june 2021 and also we have falling wedge pattern that's give us signals for long position
MACD is showing bullish
EMAs showing a bullish move
RSI is neutral
targets set at the chart

Was wondering when $RUNE again..Hey, something way too cheap imo is RUNE at the moment - without any significant upside movement... trend is not their (yet)... but what do you think??

RUNEUSDTPERP (FUTURES) Possible Out come for Rune today 10/09/2022
So Rune broke Below Highrt Low and retest .
made another Low at fibs pocket level and now going back to restest previous Low
\We should always think in probabilities so yeah we try to consider the probability of price
Retesting previous low and probability of price breaking that low and retesting Previous HL

RUNE POTENTIAL LONGRUNE POTENTIAL LONG!!
This is my view using smc method
TRADE WITH YOUR OWN RISK!!

🟢 RUNEUSDT - 1D (08.10.2022)🟢 RUNEUSDT
TF: 1D
Side: Long
SL: $1.4358
TP 1: $1.8715
TP 2: $2.1156
TP 3: $2.3129
Bullish divergence on 1D.
We should see RUNE fly from the week commencing 10/10/2022.

RUNE can be touch several TPsTHORChain is a decentralized liquidity protocol that allows users to easily exchange cryptocurrency assets across a range of networks without losing full custody of their assets in the process.
With THORChain, users can simply swap one asset for another in a permissionless setting, without needing to rely on order books to source liquidity. Instead, market prices are maintained through the ratio of assets in a pool (see automated market maker).
The native utility token of the THORChain platform is RUNE. This is used as the base currency in the THORChain ecosystem and is also used for platform governance and security as part of THORChain's Sybil resistance mechanisms — since THORChain nodes must commit a minimum of 1 million 300k RUNE to participate in its rotating consensus process.
THORChain was funded through an initial DEX offering (IDO) which launched through the Binance DEX in July 2019. Its single-chain chaosnet launched in April 2021, the multi-chain upgrade was launched in April 2021 and Mainnet is now live as of Jun 2022.
Buy setup
Entry : 1.33 - 1.59
SL : 1.145
TP1: 1.64
TP2: 1.7
TP3: 1.77
TP4: 1.85
TP5: 1.95
TP6: 2.1
TP7: 2.3
TP8: 2.5
TP9: 2.8
TP10: 3.2
TP11: 3.6
TP12: 4
TP13: 4.45
TP14: 4.9
TP15: 5.35
Spot or Future (1x, 2x, and 3x)
Run and enjoy it!
Follow me! Copy my trade!
TradeSetup_Reza

Buy setup #RUNEUSDT Buy setupfor RUNEUSDT, ABC pattern. Its fully corrected IMO and ready for the next leg up

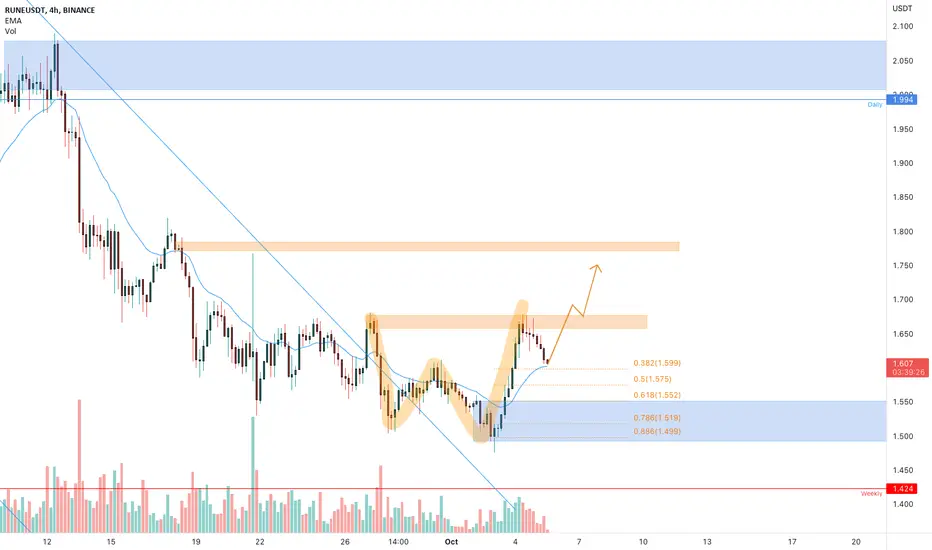
RUNEUSDT is testing the 0.382 Fibonacci levelThe price is testing the W's Neckline at 0.382 Fibonacci level after a bullish impulse form the demand zone (1.5$ area)
How to approach it?
IF the price is going to have a breakout from the 4h resistance and retest as new support, According to Plancton's strategy , we can set a nice order
–––––
Keep in mind.
🟣 Purple structure -> Monthly structure.
🔴 Red structure -> Weekly structure.
🔵 Blue structure -> Daily structure.
🟡 Yellow structure -> 4h structure.
⚫️ black structure -> <= 1h structure.
–––––
Follow the Shrimp 🦐

RUNE/USDTRUNE/USDT
As I expected, the pattern broke to the upside.
I expect little at all and then perform an upward movement from this currency.
#RUNE #RUNEUSDT #BTC #BTCUSD #LUNA #LUNC #UST

RLinda ! RUNEUSDT-> Wedge resistance breakdown. What next?RUNEUSDT on the lower timeframe we see the formation of a bearish downward movement, the price updating global lows and stopping the price in the zone of 1.450
On the global chart, we can see the price testing a strong support level, a decrease in volatility - the transition of the price into sideways movement, which indicates a set of energy in the "consolidation" format. The price makes a rebound from the support and breaks through the local resistance
The price forms a bullish set-up in a bear market, which is capable of reversing the market. The price has been forming the resistance since the end of August and today we see the breakdown and the price breaking beyond the level of 1,608. I assume that the price will move up after the breakdown of the wedge resistance. The short-term target is the resistance at 1.77, the medium-term target is the liquidity area at 1.82
Regards R.Linda!

#RUNE $RUNE
#RUNE $RUNE
#BTC
- SHARK Pattern 🦈
- Daily Frame
- R/R : 14.92 / 1
#This is my technical opinion and not a recommendation to buy or sell

how did Rune did follow melast time i did predict that short entry on Rune and it did follow me and birds are enjoying it well

RUNE/USDTRUNE/USDT
Formed a descending angle pattern.
An upward divergence is seen in the four-hour time frame.
The possibility of price increase up to 2 dollars is not out of mind.
#RUNE #RUNEUSDT #BTC #BTCUSD #LUNA #LUNC #UST

RUNE - 1D bottom of the trading rangeWe have a trading range in the daily chart of Rune coin. A couple of reasons show us the price can rise from this supporting zone.
On the one hand, the price fell from the supply zone to the mid of trading range in seven days, while the second leg took about a month which shows us the weakness of sellers.
On the other hand, it's about ten days that we are at the trading range, and buyers don't let the price cross the demand zone.
So if the trend line breaks, buyers will start to buy more, sellers will join them, and we'll have a bullish trend for at least a few days.

RUNE/USDT - LONG----- Welcome, dear followers! -----
- Here is my trading methodology. I trade with a normal system and analysis of resistance and support, as well as price reversal patterns.
- For the record, I do not place a stop loss within my trades. So that I only risk 1.5% of my total capital in order to support the loss due to a price reversal against me.
- If a price reversed against my expectation and touched the drawn line r3, then I transferred targets to the entry point and waited for the price to close at it with a loss equal to almost zero.
- Today's deal is shown in the chart, and here are the entry and exit points below.
-- Support me with numbers and follow up on my account for other deals in the future. Thank you for coming to this part. --
-------------------------------------------------------

Rune USDT BUY Buy option is offered in Rune the TP will be between 6,500 and 7,600 do not forget the SL it is important for RISK MANAGEMENT good trade.

RUNEUSDTHello Crypto Lovers,
Mars Signals team wishes you high profits.
This is a one-day-time frame analysis for RUNEUSDT
Here you see R1 as a resistance line that expresses the unsuccessful triumphs of the price to rise. R2 used to be support area and S1 is another support area which represents the support of price since the past. Presently, we have the price fluctuating on S1 and we believe the falling would continue toward the bottom of S1 and then we must wait for some rising signs to happen. At this time, we will predict an increase for the price up to R1 or even higher. In case the price moves below S1, more fall will happen to it (this is not so probable now).
Warning: This is just a suggestion and we do not guarantee profits. We advise you to analyze the chart before opening any positions.
Wish you luck

rune setupdxy coming down
btc going up
inverse h&s rune
rune broke downwords trenline to the upside.

RUNE into Wyckoff Acumulation phaseI just started this analysis finding strongest supports in high timeframes such D1 and D3 because bearish trend line makes a perfect 90 degrees triangleand wanted to know a perfect LONG entry near to biggest support in D3 (horizontal blue line). We can easily see in the RUNE chart Wyckoff’s Acumulation Phase Pattern and we can also guess about future Bullish Cup & Handle Pattern will be created in a couple of months maybe in W1 we can get notice about it.
Please wait till RUNE will be little bit near to strongest and biggest support (blue line).

RUNEUSDT | FALLING WEDGERUNEUSDT has been converging in a falling wedge , it is well supported from the rising trendline on shorter term. If it continue to respect the rising trendline then we will have a good breakout on the upside. Trade your levels accordingly
