RUNE into Wyckoff Acumulation phaseI just started this analysis finding strongest supports in high timeframes such D1 and D3 because bearish trend line makes a perfect 90 degrees triangleand wanted to know a perfect LONG entry near to biggest support in D3 (horizontal blue line). We can easily see in the RUNE chart Wyckoff’s Acumulation Phase Pattern and we can also guess about future Bullish Cup & Handle Pattern will be created in a couple of months maybe in W1 we can get notice about it.
Please wait till RUNE will be little bit near to strongest and biggest support (blue line).
RUNEUSDT trade ideas

RUNEUSDT | FALLING WEDGERUNEUSDT has been converging in a falling wedge , it is well supported from the rising trendline on shorter term. If it continue to respect the rising trendline then we will have a good breakout on the upside. Trade your levels accordingly


RUNEUSDT - 1D Short signal💡💡SIGNAL 💡💡
RUNE / USDT
▶️ Sell NOW + Block
🔴 SLT - 1D (trigger)
My last idea took TP1 and closed at breakeven on September 21. This is the second attempt.
1D the trend is downward, SL at the break point of the trend.
#RUNEUSDT_1D_230922

RUNEUSDT | SETUPRUNEUSDT has broken above the falling trendline.
The price has also formed double bottom.
The bulls need to sustain price above the 0.236 fib level.
The bulls are in control.
Trade your levels accordingly.

RUNEUSDT - 1D short signal💡💡#SIGNAL 💡💡
RUNE / USDT
▶️ Sell in Block
🔴 SLT - 1D (trigger)
Until September 21, trading is an extremely dangerous idea, but I will open a couple of trades.
My last trade was canceled because the price did not reach the sales block and fell down. This is the second attempt.
#RUNEUSDT_1D_190922

Is RUNE RUINED ?RUNE is showing a ton of bearish signals...
1. Rising Wedge, broken below the bottom and now will drop the height of the rising wedge.
2. Inverse cup and handle - Broken below the brim level... Next target 0.21
3. RSI Bearish - Continues to make lower highs and stay below the 50 (bearish) mark.
4. All Moving Averages are down 7<21<50<200
They are going to need one heck of a catalyst to push this price up. Or the Crypto major winter needs to end soon!
Sorry Rune.
However, all indicators are based on the past and only tell us about probabilities rather than certainties.

RUNEUSDthink alts see some releif here...
overall extreme fear in the markets and we are retesting the lows on a lot of decent projecs
see how we go...
bullish cfork here also

RUNEUSDT - short signal💡💡#SIGNAL 💡💡
RUNE / USDT
▶️ Sell in Block
🔴 SLT - 1h (trigger)
Crazy PLR 😂. So there should have been 1D TF, but the stop is very far away, so I will try 1h.
#RUNEUSDT_1h_180922

Rune to ruin? Elliott Wave Only 2 possibilities after an impulse pattern in EWI Elliott Wave, either a retrace to take out its low or an internal retracement and then trend continuation. In this is situation I am seeing both possibilities, atm so its all on how this retrace plays out. If inspiring/helpful, boost and follow. Cheers!

RUNEUSDT | SUPPORT BROKENRUNEUSDT has broken below the horizontal support. The price has also retested the broken support now acting as resistance. The bears are in control. Trade your levels accordingly.

RUNE 4hr LONG IDEARUNE has pulled back into range lows after CPI data - Looking at longs from this area with a tight stop

RUNE, break the resistance.The following are machine translations:
In the 4-hour chart, after breaking through resistance 2, it oscillated sideways near 2. Now it is rushing up again and continues to be bullish.
The indicator macd bullish trend, rejecting Sicha. The RSI is trading above the neutral 50 and is in bullish territory.
Summary: After the pattern broke through the resistance, it stabilized near the resistance and went up again, and the indicator was bullish. In operation, it is necessary to do more near 2, stop loss at 1.97, and target near 2.25.


#RUNEUSDT 4H Chart
Price broke above the resistance around $1.98 and it still moving up. MACD is bullish, RSI is bought and EMAs are neutral. I expect price to now reach the 4h supply at $2.16.

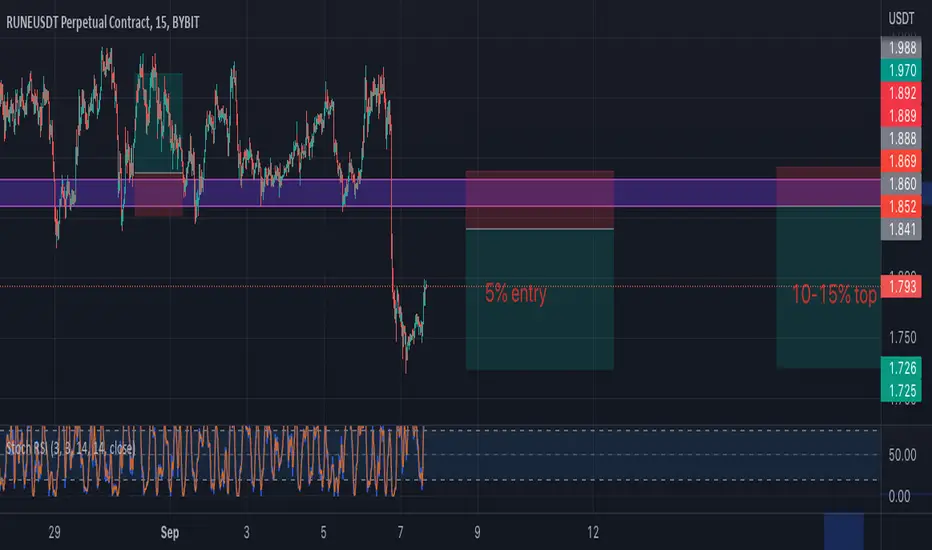
RUNEUSDTtwo lil setup for Rune, decide on how big u going to trade rune first entry should be a lil as possible, then if we do get a deeper retracement as shown on the chart then u can entry with the rest. ratio 1: 3,5 good ratio
RUNEUSDT | PRICE CONVERGINGRUNEUSDT has been trading near the falling resistance. The price has converging. Previously bulls tried to break above but failed.
Now again bulls need to break above the falling trendline and price must sustain above it.
Trade your levels accordingly.


Rune Ruined? Elliott WaveLooks like it printed a pretty classic correction into resistance before the dump, which is looking like a decent impulsive move down from the AOI of the last chart. Looks like it could be ready for a correction, so I am watching for it to correct in potentially the same way into some resistance before more down. If this helps please boost and follow, Cheers!

RUNEUSDT - 4h Short signal💡💡#SIGNAL 💡💡
RUNE / USDT
▶️ Sell NOW + Blue Line
🔴 SLT - 4h
#RUNEUSDT_4h_040922

RuneusdtI am long in the rune, I hope it will make me happy with a pump. The price suspected the downward trend line and exited it. I put the loss limit below the resistance. This is not a buy or sell offer, this is just a gamble.

$RUNE - showing strength for bulls$RUNE on 4HTF breaking of TL and i m expecting it to hit my TP zones at 1. 2.27 2. 2.45
MACD bullish C.O. done on the chart
RSI crossing 50
