Update on RUNELike i said on rune when we are on 2.20 , i said it will be bullish about 35% we gain from it and I believe we will have another bull move to the top of trend line if btc hold it above the trend line .. your stop losses will not be on chart of rune this time , this time will be on btc .. good luck, and I’m glad to receive your thoughts.
RUNEUSDT trade ideas

RUNEusdt analysisEverything is clear in the chart
According to my previous analysis, which was done in a simple way
This is also located on the roof of the channel
**This is an analysis, do not consider it for buying and selling**

RUNE ANALYSISHere we can see RUNE running in a parallel channel
Hence need to touch the target according to pattern
Stoploss given in chart
thank you for supporting

RUNE/USDT possible movementGood morning traders
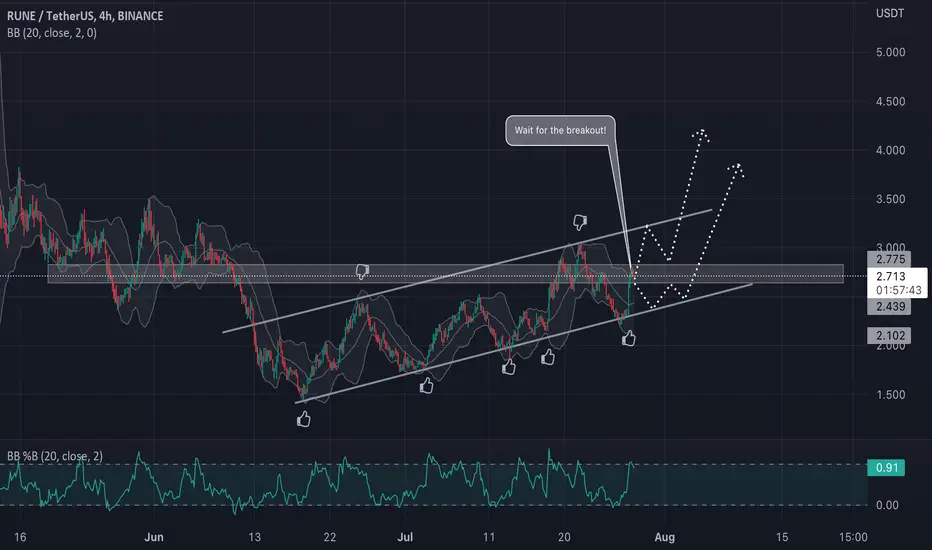
This time we are looking at RUNE/USDT. We see a great setup for this coin. HH and HL are being made and now we are at the lvl of $2.7 which is major lvl at the moment. Breaking this would mean bull run and holding this would mean going back to $2.35 from where we should see green candles
If you like ideas provided by our team you can show us your support by liking and commenting.
Yours Sincerely,
Swallow Team 🔱
Disclamer:
We are not financial advisors. The content that we share on this website are for educational purposes and are our own personal opinions!
RUNEUSDTHello Crypto Lovers,
Mars Signals team wishes you high profits.
This is a 4-hour-time frame analysis for RUNEUSDT
According to our last analysis on July 19, we expected a falling trend and at the present, this has happened and all of our targets are hit. In the current chart, we have R2 and R1 as the resistance areas and they involve the unsuccessful triumphs of the price to rise. And S1 is our support area which includes the support of the price at some points since the past. Here the price is fluctuating below R1 and we believe it will rise to R1 and at that point, it will face two scenarios. Either it is able to fix over this line and face more increase toward R2. Or it may lose the support at R1 area and start a decline to S1.
Warning: This is just a suggestion and we do not guarantee profits. We advise you to analyze the chart before opening any positions.
Wish you luck

*** RUNE recovery ***3 LONG coins for today training XTZ , RUNE , and GALA.
They are @ end of channel and strong support area and all of them have potentional for growth.
You can check analysis of them on my profile. everything is clear !
RUNE---> TP : 2.517
** THIS IS JUST MY IDEA**

Target almost done After i published the plan for RUNEUSDT we almost reached the bottom of the trend line (2.17$)I think we will go to the top of trend line 3$, invalid if we didn’t hold the trend line and it’s very bearish. Please put your stop loss on the bottom of the trend line

📈THORChain (RUNE) Jul-26 #RUNE $RUNEAt the moment, RUNE is falling to the $2 zone, which is the last support of the uptrend since mid-June. We need to look carefully at the price action here to consider buying it.
If RUNE holds the $2 zone, it can rally back to the $3 zone and even $4.5
However, if it loses the $2 zone, it will have a crash similar to the beginning of June to fall back to the $1-1.2 zone, which will be a worthy accumulation zone for the long-term goal.

RUNEUSDT ! Falling along the trend after a resistance test🤔RUNEUSDT coin earlier tried to break the downtrend. To some extent, it succeeded and formed an uptrend channel, as the price moved in which resistance to the downtrend was broken and impulse for 33% of the price movement was made.
On the chart we see a false break of the resistance of 2.47, after which the price makes an impulse down and the subsequent correction to the level. The price is in the short zone - the selling zone.
I assume that the price will be able to consolidate under the level of 2.47 and follow the fall of bitcoin. The local uptrend on the chart is broken, the bears are showing their strength. The short-term target is support at 2.16. Two medium-term targets are support at 1.975 and 1.750.
Regards R. Linda!

RUNEUSDT Coin review, will it break through support or not?Hello trader👋 Today I prepared a new idea for you. Like and subscribe to the channel there is a lot of useful information✅
RUNE is testing the support that was previously resistance, I think it is still in this zone, after which we will go down to about $2.262


TP hitRespected order block and ran down with a good move but had a little pull back but ended with a good run

Rune Bearish countHave some interesting Elliott Wave price action on this one. Some nice potential impulses to play off of. This would be the bearish variant. Bulls really need to break above and flip 3-3.40. Could be done at this point but there is a potential for one more leg up, before either more sideway or another leg lower. If helpful, like, follow and boost. Cheers.

Potential upsideI'm currently looking at the market with a bearish bias but I think there's a chance for us to climb up a bit before the leg down , we've had a break of structure to the upside, hopefully we tap into the demand zone before a move upward
Nfa

Bearish movement Resistance and order block and 0.786 fib level
Due to order block there's a high probability of going towards downward trend with good red candles

Rune 1H , CautionI think we will visit 2,20 after we formed double top , and also we couldn’t breakthrough the top of the trend , be cautious and soon we will have federal meeting which will create strong move on the markets (could be bearish , bullish) , put you stop loss and be careful and don’t trade by emotions .
I’m happy to receive thoughts :)

RUNERUNE/USDT we are looking for this coin to Retest one more time Our OB zone and to take LONG position

RUNE/USDT TRADE SETUP! READY TO PUMP 100%!!Hello everyone, if you like the idea, do not forget to support with a like and follow.
Welcome to this RUNE/USDT trade setup.
RUNE looks good here. Breaks out from the big symmetrical triangle in 6hr time frame. Expecting a big move to the upside from here.
Entry range:- $2.34-$2.44
Target1:- $2.72
Target2:- $3.02
Target3:- $3.44
Target4:- $4.44
SL:- For leverage ($2.22)
For spot ($2.00)
If you like this idea then do support it with like and follow.
Also, share your views in the comment section.
Thank You!

RUNEUSD ❕ price in the liquidity zoneThe coin has moved out of the upward channel and looks overbought.
Rune moves in the liquidity zone.
Price and RSI have formed a bearish divergence (4H TF)
The stock has moved into a bearish RSI zone (30m TF)
Rune has broken down 50MA (30m TF)
I expect the continuation of the decline after the price fixation under the support level.

💡Don't miss the great buy opportunity in RUNEUSD @THORChain
Trading suggestion:
". There is a possibility of temporary retracement to the suggested support line (1.874).
. if so, traders can set orders based on Price Action and expect to reach short-term targets."
Technical analysis:
. RUNEUSD is in a range bound, and the beginning of an uptrend is expected.
. The price is below the 21-Day WEMA, which acts as a dynamic resistance.
. The RSI is at 64.
Take Profits:
TP1= @ 2.097
TP2= @ 2.268
TP3= @ 2.437
TP4= @ 2.701
TP5= @ 3.057
TP6= @ 3.370
SL= Break below S2
❤️ If you find this helpful and want more FREE forecasts in TradingView
. . . . . Please show your support back,
. . . . . . . . Hit the 👍 LIKE button,
. . . . . . . . . . Drop some feedback below in the comment!
❤️ Your support is very much 🙏 appreciated! ❤️
💎 Want us to help you become a better Forex / Crypto trader ?
Now, It's your turn !
Be sure to leave a comment; let us know how you see this opportunity and forecast.
Trade well, ❤️
ForecastCity English Support Team ❤️

RuneusdtHi friends as you see price broke out of dynamic resistance line but we have very important static resistance area,I think price need to go back to regain more power to break that area, so be ready for this senario
EkiL

RUNEUSDTSignificant volume increase and double pattern in play. In indicators side, expecting bullish cross. However, I placed long already as risk/reward is very promising. Previously, Rune had very strange cycles of huge pumps and dumps.
