ED1! trade ideas

EURO FX Futures ( 6E1! ), H4 Potential for Bearish DropTitle: EURO FX Futures ( 6E1! ), H4 Potential for Bearish Drop
Type: Bearish Drop
Resistance: 1.10590
Pivot: 1.08270
Support: 1.05290
Preferred case: Looking at the H4 chart, my overall bias for 6E1! is bearish due to the current price being below the Ichimoku cloud , indicating a bearish market. If this bearish momentum continues, expect price to possibly continue heading down towards the support at 1.05290, where the previous swing low is.
Alternative scenario: Price may head back up towards the resistance line at 1.10590 where the previous swing high is.
Fundamentals: There are no major news.

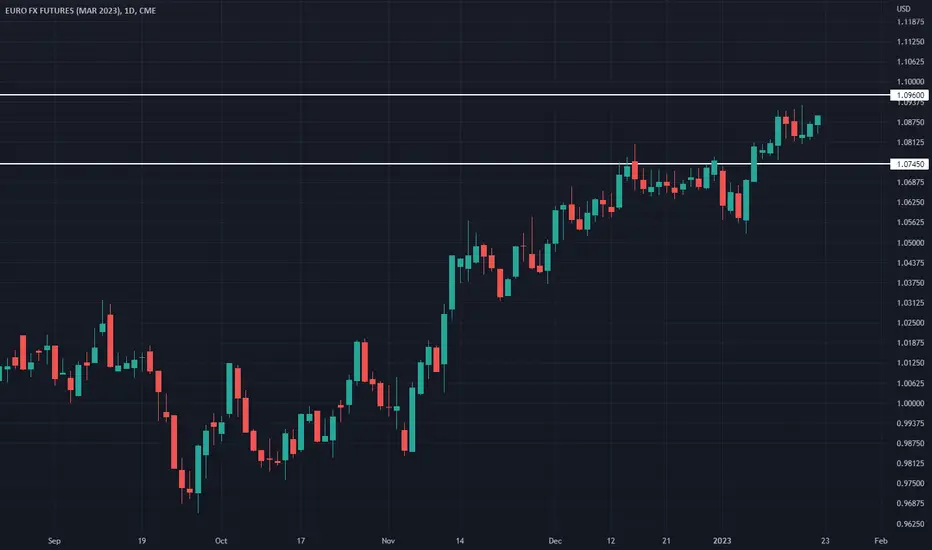
6EH3 High: 1.0960 Low: 1.0745 SidewaysWeekly Kickoff levels are longer timeframe levels where we believe longer time traders will adjust inventories.

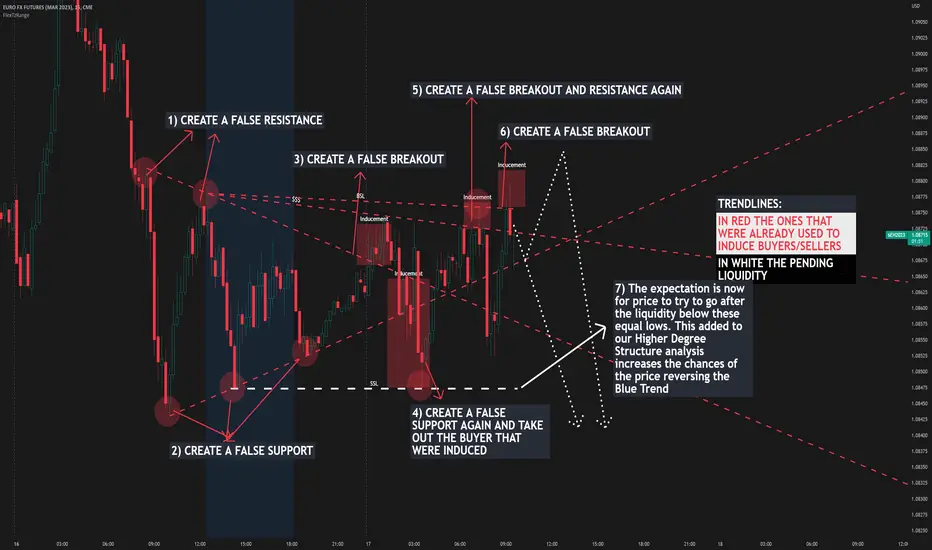
EURUSD Short-Term Bullish AnalysisClick on Boost (like) to support these free analyses
This expectation is a framework to look for a potential trading setup; I recommend you to not just execute based on these levels. I always wait for confirmations on lower timeframes
This Analysis was done using my complete Strategy which includes:
- Smart Money Concepts
- Multi Timeframe Liquidity and Market Structure
- Supply And Demand
- Auction Theory
- Volume Analysis
- Footprint
- Market Profile
- Volume Profile
- Wyckoff
- Etc.

6E!CME:6E1!
looks like this will be in a range for some time
can see moves between those lvls marked

6EH3 High: 1.0960 Low: 1.0745 HigherWeekly Kickoff levels are longer timeframe levels where we believe longer time traders will adjust inventories.

6E!CME:6E1!
EUR forex
going good on the hourly
needs to hug the median and keep up
heading into short zone scalp
R2 1.098
R1 1.095
and
S1 1.091
S2 1.088

6EH3 High: 1.0960 Low: 1.0745 HigherWeekly Kickoff levels are longer timeframe levels where we believe longer time traders will adjust inventories.
EURO FX Futures ( 6E1! ), H4 Potential for Bullish ContinuationTitle: EURO FX Futures ( 6E1! ), H4 Potential for Bullish Continuation
Type: Bullish Continuation
Resistance: 1.09390
Pivot: 1.07540
Support: 1.05675
Preferred case: Looking at the H4 chart, my overall bias for 6E1! is bullish due to the current price being above the Ichimoku cloud , indicating a bullish market. If this bullish momentum continues, expect price to continue moving towards the overlap resistance at 1.09390, where the 50% Fibonacci line is.
Alternative scenario: Price may head back down to retest the pivot at 1.07540, where the 38.2% Fibonacci line is.
Fundamentals: There are no major news.

EURO FX Futures ( 6E1! ), H4 Potential for Bullish ContinuationTitle: EURO FX Futures ( 6E1! ), H4 Potential for Bullish Continuation
Type: Bullish Continuation
Resistance: 1.09390
Pivot: 1.07540
Support: 1.05675
Preferred case: Looking at the H4 chart, my overall bias for 6E1! is bullish due to the current price being above the Ichimoku cloud, indicating a bullish market. If this bullish momentum continues, expect price to continue moving towards the overlap resistance at 1.09390, where the 50% Fibonacci line is.
Alternative scenario: Price may head back down to retest the pivot at 1.07540, where the 38.2% Fibonacci line is.
Fundamentals: There are no major news.

EURUSD Short Term Analysis/ExpectationClick on Boost (like) to support these free analyses
This expectation is a framework to look for a potential trading setup; I recommend you to not just execute based on these levels. I always wait for confirmations on lower timeframes
This Analysis was done using my complete Strategy which includes:
- Smart Money Concepts
- Multi Timeframe Liquidity and Market Structure
- Supply And Demand
- Auction Theory
- Volume Analysis
- Footprint
- Market Profile
- Volume Profile
- WYCKOFF (IS THE KING)
- ETC
Where is the EURUSD headed amid the EU and US inflation lag?We hope everyone had a great start to the year! As we think about the year ahead and some of the major themes that might play out, the EU vs US inflation story is among those catching our eyes now in particular.
“Inflation” & “Rate Hikes” were the main talking points for the US Economy in 2022 as the US Federal Reserve (Fed) reacted and adjusted to stubborn inflation. On the other side of the Atlantic, a similar situation is playing out, albeit with a 4 to 7 months lag behind the US.
Measuring the difference between the turning points, we can roughly determine the lag between the economic indicators. Headline Inflation (top chart) in the US moved up close to 7 months before the EU’s. Core Inflation (middle chart) in the EU lags the US by 5 months. Policy reaction (bottom chart) of the European Central Bank (ECB) lags the Fed by 4 months.
This dynamic is important when trying to understand the path forward for the EURUSD currency pair as central banks watch inflation figures and adjust policy rates accordingly.
EU & US policy rate differentials help us sniff out major turning points for the EURUSD pair. As seen in the chart above, the yield differential measured using CME Eurodollar and Euribor futures, started to widen in September 2021, which marked the EURUSD tumble from 1.160 all the way to 0.987.
But now it appears the reverse is happening. Yield differentials are starting to close as markets adjust to slower pace of rate hike environment in the US while ECB still battles stubbornly high inflation. Using CME’s Fed watch tool as well as Bloomberg’s OIS Implied Euro interest rate probability tool, we can estimate the market implied forward path for the 2 major central bank’s policy rates. With the market expecting the Fed to pause rate hikes in March, while the ECB is expected to only pause in July. Interestingly, the difference in expected rate pivot is in line with the 4 to 7 months lag in economic conditions we established from the analysis above. As the ECB continues to hike while the Fed pauses, yield differential is likely to close, helping to boost Euro’s attractiveness against the USD.
Coupled with the dollar’s downward momentum, This could favor further strength in the EURUSD pair.
On the technical front, we see a golden cross with 50-day moving average crossing above the 200-day moving average for the pair. Coupled with an uptrend and spike in the RSI, it has marked the recent up trends remarkably well. If this historical behavior holds, the EURUSD pair could still have further room to run.
For those who use Parabolic SAR, the current chart has just flipped back to a buy signal after the recent price consolidation.
Given the ECB’s policy lag, dollar weakness, and a bullish technical setup, we lean on the buy side for the EURUSD pair. We set our stop at the 1.0520 level, and take profit level at 1.12800, with each 0.00005 increments per EUR in the EURUSD futures contract equal to 6.25$.
Do also check out our previous EURUSD idea which played out nicely:
The charts above were generated using CME’s Real-Time data available on TradingView. Inspirante Trading Solutions is subscribed to both TradingView Premium and CME Real-time Market Data which allows us to identify trading set-ups in real-time and express our market opinions. If you have futures in your trading portfolio, you can check out on CME Group data plans available that suit your trading needs www.tradingview.com
Disclaimer:
The contents in this Idea are intended for information purpose only and do not constitute investment recommendation or advice. Nor are they used to promote any specific products or services. They serve as an integral part of a case study to demonstrate fundamental concepts in risk management under given market scenarios. A full version of the disclaimer is available in our profile description.
Sources:
www.cmegroup.com
www.cmegroup.com
Bloomberg

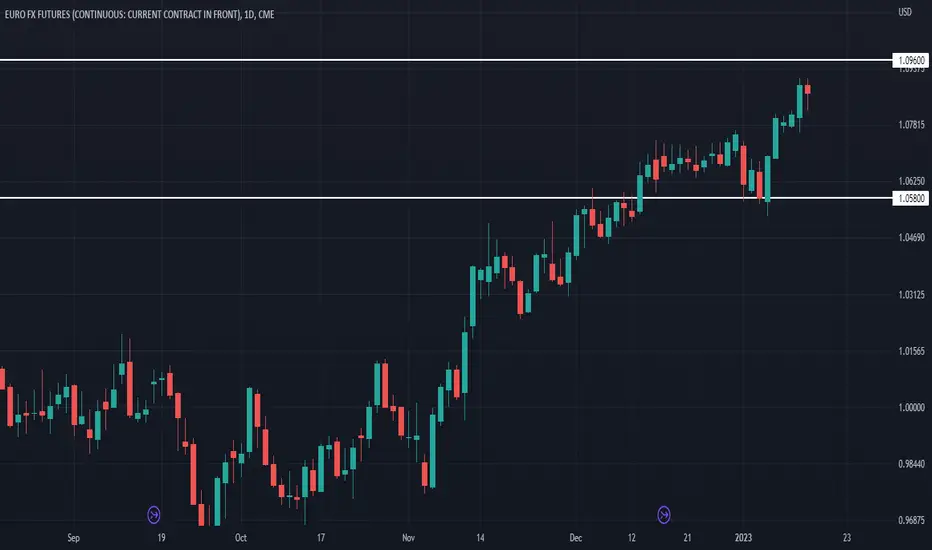
6EH3 High: 1.0960 Low: 1.0580 HigherWeekly Kickoff levels are longer timeframe levels where we believe longer time traders will adjust inventories.
6EH3 High: 1.0756 Low: 1.0400 SidewaysWeekly Kickoff levels are longer timeframe levels where we believe longer time traders will adjust inventories.

EURO FX Futures ( 6E1! ), H4 Potential for Bearish DropTitle: EURO FX Futures ( 6E1! ), H4 Potential for Bearish Drop
Type: Bearish Drop
Resistance: 1.07670
Pivot: 1.05085
Support: 1.03315
Preferred case: Looking at the H4 chart, my overall bias for 6E1! is bearish due to the current price being below the Ichimoku cloud , indicating a bearish market. If this bearish momentum continues, expect price to possibly head back down to break the pivot at 1.05085 where the previous high was before heading down towards the support at 1.03315, where the 23.6% Fibonacci line is.
Alternative scenario: Price may head back up towards the 1st resistance line at 1.07670 where the previous swing high is.
Fundamentals: There are no major news.

EURO FX Futures ( 6E1! ), H4 Potential for Bearish DropTitle: EURO FX Futures ( 6E1! ), H4 Potential for Bearish Drop
Type: Bearish Drop
Resistance: 1.07670
Pivot: 1.05085
Support: 1.03315
Preferred case: Looking at the H4 chart, my overall bias for 6E1! is bearish due to the current price being below the Ichimoku cloud, indicating a bearish market. If this bearish momentum continues, expect price to possibly head back down to break the pivot at 1.05085 where the previous high was before heading down towards the support at 1.03315, where the 23.6% Fibonacci line is.
Alternative scenario: Price may head back up towards the 1st resistance line at 1.07670 where the previous swing high is.
Fundamentals: There are no major news.

6EH3 High: 1.0835 Low: 1.0600 HigherWeekly Kickoff levels are longer timeframe levels where we believe longer time traders will adjust inventories.

EURO FX Futures ( 6E1! ), H4 Potential for Bullish ContinuationTitle: EURO FX Futures ( 6E1! ), H4 Potential for Bullish Continuation
Type: Bullish Continuation
Resistance: 1.07935
Pivot: 1.05085
Support: 1.03315
Preferred case: The current bias for 6E1! on the H4 chart is bullish. To add to this bias, the price is currently above the Ichimoku cloud, indicating a bullish market. If this bullish momentum continues, expect price to possibly continue heading towards the 1st resistance line at 1.07935 where the previous swing high is.
Alternative scenario: Price may possibly break the pivot at 1.05085 where the previous high was before heading down towards the support at 1.03315, where the 23.6% Fibonacci line is.
Fundamentals: There are no major news.

EURO FX Futures ( 6E1! ), H4 Potential for Bullish ContinuationTitle: EURO FX Futures ( 6E1! ), H4 Potential for Bullish Continuation
Type: Bullish Continuation
Resistance: 1.07935
Pivot: 1.05085
Support: 1.03315
Preferred case: The current bias for 6E1! on the H4 chart is bullish . To add to this bias, the price is currently above the Ichimoku cloud , indicating a bullish market. If this bullish momentum continues, expect price to possibly continue heading towards the 1st resistance line at 1.07935 where the previous swing high is.
Alternative scenario: Price may possibly break the pivot at 1.05085 where the previous high was before heading down towards the support at 1.03315, where the 23.6% Fibonacci line is.
Fundamentals: There are no major news.

EURO FX Futures ( 6E1! ), H4 Potential for Bullish ContinuationTitle: EURO FX Futures ( 6E1! ), H4 Potential for Bullish Continuation
Type: Bullish Continuation
Resistance: 1.07935
Pivot: 1.05085
Support: 1.03315
Preferred case: The current bias for 6E1! on the H4 chart is bullish . To add to this bias, the price is currently above the Ichimoku cloud, indicating a bullish market. If this bullish momentum continues, expect price to possibly continue heading towards the 1st resistance line at 1.07935 where the previous swing high is.
Alternative scenario: Price may possibly break the pivot at 1.05085 where the previous high was before heading down towards the support at 1.03315, where the 23.6% Fibonacci line is.
Fundamentals: There are no major news.
