$QIWI proposes to be one of the good performersAs you can see, there is divergence on the downward MOEX:QIWI moving on the 1D graph with a high overselling. I'm expecting turning around and preparing of the baseline for the future leaps.
Goal number 1 is 490, which can bring more than 100% during 1-1.5 years.
Does not constitute a recommendation.
#furoreggs #investing #stocks #shares #idea #forecast #trading #analysis
If you want to discuss, please subscribe and challenge this point of view.
QIWI trade ideas

$QIWI - time for correction has comeMOEX:QIWI - expecting 2 waves of correction before we will be able to get on the train that is going upstairs.
Does not constitute a recommendation.
#furoreggs #investing #stocks #shares #idea #forecast #trading #analysis
If you want to discuss, please subscribe and challenge this point of view )

Traditional|QIWI|LongLong QIWI
Activation of the transaction only when the blue zone is fixed/broken.
The author recommends the use of anchoring fixed the blue zone, this variation is less risky.
If there is increased volatility in the market and the price is held for more than 2-3 minutes behind the activation zone after the breakdown, then the activation of the idea occurs at the prices behind the activation zone.
The idea is to work out the resistance level .
* Possible closing of a trade before reaching the take/stop zone. The author can close the deal for subjective reasons, this does not completely cancel the idea and is not a call to the same action, you can continue working out the idea according to your data, but without the support of the author.
+ Maybe right now we will go even lower, then it's okay, the idea is not activated and simply canceled.
+ ! - zone highlighted by the ellipse is a zone of increased resistance, in this area there is a possible reversal for a correction, please take this factor into account in this transaction.
The "forecast" tool is used for more noticeable display of % (for the place of the usual % scale) of the price change, I do not put the date and time of the transaction, only %.
Blue zones - activation zones.
Green zones - take zones.
Red zone - stop zone.
Working out the stop when the price returns to the level after activation + fixing in the red zone.
Orange arrow - the direction of take.
The red arrow - the direction of the stop.
SUM PNL: This parameter displays the total % of all closed ideas of the "new" format (according to the author) for this sector at the time of publication of the idea. The calculation is very "clumsy" just the sum of the profits of all the ideas, based on this indicator, you can more accurately assess the risks when working with my ideas of this sector. I present you the construction of the idea, you can use it yourself as you like based on your subjective view and risks, the calculation of the PNL indicator is carried out only on transactions that the author closed on TV in manual mode or by take.
P.S Please use RM (risk management) and MM (money management) if you decide to use my ideas, there will always be unprofitable ideas, this will definitely happen, the goal of the system is that there will be more profitable ideas at a distance.

Traditional|QIWI|LongLong QIWI
Activation of the transaction only when the blue zone is fixed/broken.
The idea is to work out the resistance level .
* Possible closing of a trade before reaching the take/stop zone. The author can close the deal for subjective reasons, this does not completely cancel the idea and is not a call to the same action, you can continue working out the idea according to your data, but without the support of the author.
+ Maybe right now we will go even lower, then it's okay, the idea is not activated and simply canceled.
The "forecast" tool is used for more noticeable display of % (for the place of the usual % scale) of the price change, I do not put the date and time of the transaction, only %.
Blue zones - activation zones.
Green zones - take zones.
The red zone - stop zone.
Working out the stop when the price returns to the level after activation + fixing in the red zone.
Orange arrow - the direction of take.
Blue arrow - neutral scenario without activating the trade.
The red arrow - the direction of the stop.
SUM PNL: This parameter displays the total % of all closed ideas of the "new" format (according to the author) for this sector at the time of publication of the idea. The calculation is very "clumsy" just the sum of the profits of all the ideas, based on this indicator, you can more accurately assess the risks when working with my ideas of this sector. I present you the construction of the idea, you can use it yourself as you like based on your subjective view and risks, the calculation of the PNL indicator is carried out only on transactions that the author closed on TV in manual mode or by take.
P.S Please use RM (risk management) and MM (money management) if you decide to use my ideas, there will always be unprofitable ideas, this will definitely happen, the goal of the system is that there will be more profitable ideas at a distance.


Traditional|QIWI|Long and short *High riskLong and short QIWI
Activation of the transaction only when the blue zone is fixed/broken.
Working out the support and resistance levels of the consolidation triangle, the risk of the short scenario is weak RR (risk/reward) + the general risk of the idea is high volatility, an increase in false breakouts and a weakening of the accuracy of the TA.
*Possible closing of a trade before reaching the take/stop zone.
The "forecast" tool is used for more noticeable display of % (for the place of the usual % scale) of the price change, I do not put the date and time of the transaction, only %.
The breakdown of the upper blue zone - long.
Breakdown of the lower blue zone - short.
Working out the stop when the price returns to the level after activation + fixing in the red zone.
Blue zones - activation zones.
Green zone - take zone.
Red zone - stop zone (S-SL short stop, L-SL long stop).
Orange arrows indicate the direction of the take.
Red arrows indicate the direction of the stop.

QIWI D1QIWI Wallet's shares made a strong fall in fear of losing the license. On this news, the shares lost about 50 percent of their value. Still, this news will not be the reason for the complete collapse of the stock. Because they are used to this wallet and a large number of people will continue to use this resource. And yet I think the stocks will recover their marks. It may not be so fast. But the market is likely to adjust to the loss of the company's license.

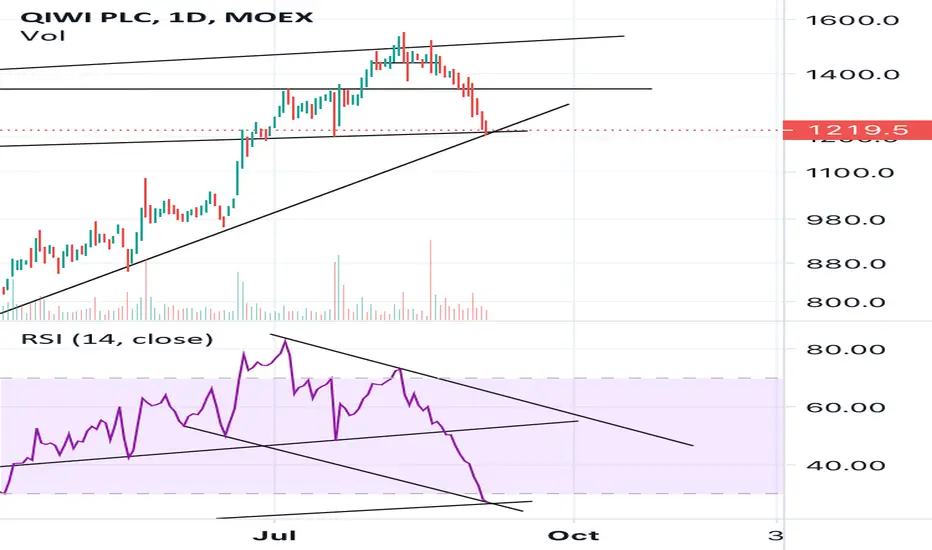
QIWI short ideaa fall past 1250 RUBs would cause me to short this stock. However, the odds are high of the stock bouncing at the support line. The RSI is in the oversold zone and there is two support lines in the 1250 range. This is a strong sell off and it could be the case that we see the stock fall even further. Volume is contracting and we could see a big price move either way.
QIWI LONG📈 QIWI LONG H4
🛒BUY above = 1536
🎯Target1 = 1580
🎯Target2 = 1607
🛑Stop loss = 1464
🙈Risk = (1%-2%)

#Qiwi - Make Russian Payment great again Last year, I introduced Kiwi first time.
After the technical breakout, Qiwi retested red trend line.
From there it rose towards the magnets, (good attraction :-)
Should Qiwi jump above 1,626 rubles per month-closing,
than 2,000 ruble mark would be the next target.

QIWI price reached at strong resistance levelQIWI price reached at strong weekly resistance level. wait for breakout. I also watching this one .
