ASCENDING TRIANGLE PATTERN BREAKOUT FOR HIGHER * LOOKING PULLBACK TO GO ANY HIGHER
* MAJOR UPTREND
* ASCENDING TRIANGLE PATTERN
RTSI trade ideas
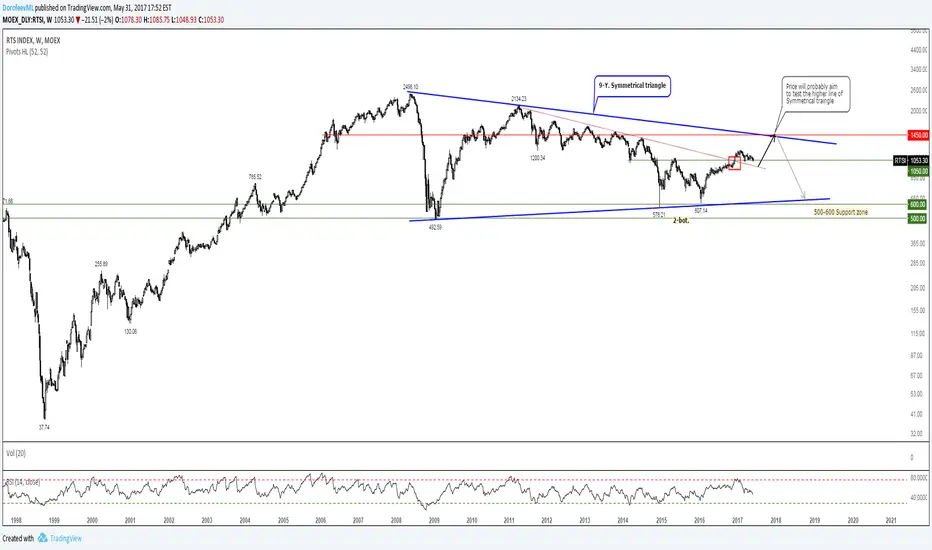
RTS Long Term Historical ForecastMedium term short.
We are in a long-term consolidation with going up, that will be a big wave of 3 or 5

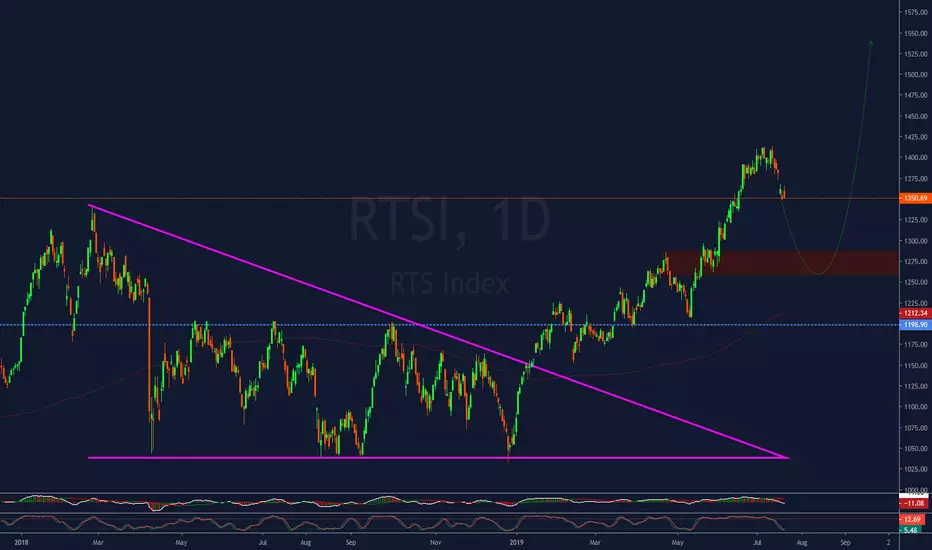
RTSI: Confirmed long term bullish break out.The Russian stock market has crossed above its long term (since 2008) long term bearish pattern this March and is currently aiming at the 1,340 1W Resistance. There is potential that the former Lower High trend line will turn into support now. Our long term target on this market is 1,500.
** If you like our free content follow our profile (www.tradingview.com) to get more daily ideas. **
Comments and likes are greatly appreciated.


RTS index could drop to 800-530 following the Brent crudeThere will be no miracle. Less revenues from falling oil market will drag the index lower
as it should be around 800 already and could hit 530 when the oil would retest a multi-year low.
The correlation index for the past 12 months shows negative correlation but it is a temporary situation
as on the longer periods (20+ months) it is positive.
This will change gradually when the index will catch up with a falling "knife" oil.


Russian index RTSI upwardsWith the announcement of the new and stronger sanctions against the russian industry and products the index RTS crashed and fell out of the older but positive trend channel.
Cause it has been an overreaction and so the recover started soon. The index rised back into the trend channel but stayed near to the lower limit.
Since this time it swung around the lower limit and has formed a secondary trend channel.
The sentiment is positive, RSI and MACD in bullish terrain.
The football worldcup showed that Russians can organise a global event; there haven´t been big chaos and no greater problems with hooligans.
This helped to get a better image of the russian culture and their capability to manage great challenges. Perhaps it´ll give a new chance for negotiations between the US and Russia; and no new bad news from Syria (concerning military confrontation between the two blocks).
The russian industry isn´t in a well situation; corrumption and political capriciousness are hindering the prosperity.
In comparison to other markets the russian isn´t overbought and overvalued.
Risks are coming from a possible correction in oilprices and the new strength from the US-Dollar.
Technically: as long as RTS stays within the trend channel (one ore both) the positiven trend is alive.

Russian Trading System Index - Daily - Found the floor?Trade Alert
The RTSI is also among those, which got hit by the global equity slide. Now, it seems that the index had found its floor. Or is it just a temporary pit stop before it continues its traveling to the downside?
Certainly, for now, continue observing the key level of support at around 1082, where the rate is right now.
A break below that level could trigger some more selling and we could potentially see the rate dropping towards the April lows at around 1042.
The alternative scenario could be if the index bounces from the current level and shows determination for a move towards the 1128 level again. A break above that could open the path for a test of the downwards moving trendline.
Always have your SL in place.

Russia Trading System Index - Daily - Bounce or break?Trade Alert.
This could be an interesting trade. Either a break or bounce.
If the support line will start to break, then there is a chance to see this index moving a bit lower, towards the test of the downwards moving trendline from above.
Alternatively, a strong bounce could mean that we could wipe out the recent highs at around 1205 and move higher.
Don't forget your stops.


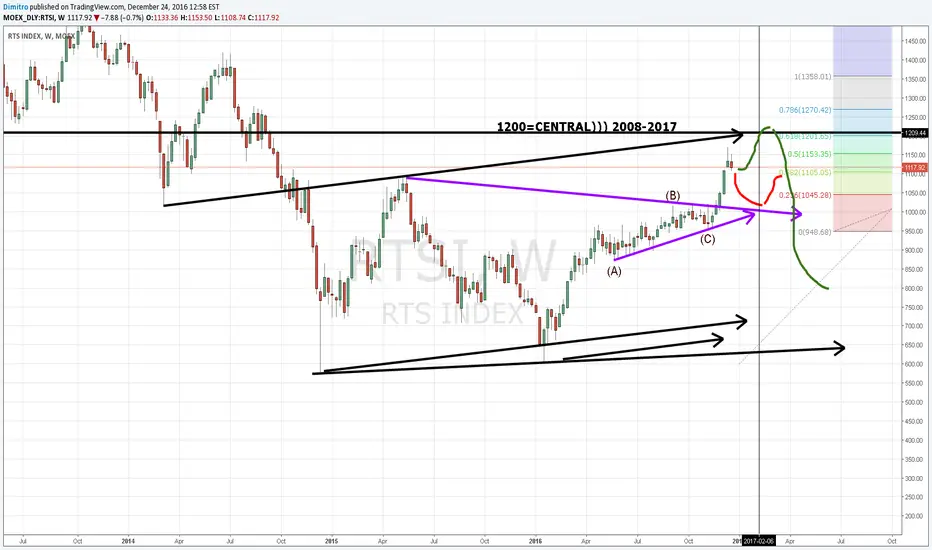
RTS Index - Crisis?Form a triangle dictates the price to go down - to finish wave (e), followed by a rise.
However, it can turn out that the wave (c) of ((d)) will stretch and leave the upper edge of the triangle. Also, under certain circumstances, it may be impulse wave. But I consider this option as an alternative.

RTSI (Russia Trading System Index) - Weekly - Red Alert!Trade Alert!
Jump on the bandwagon or be a contrarian and hope for a bit of retracement?
The index is not looking good at the moment. We could potentially see a bit of recovery by the end of the week, but for now, it looks like it is aiming to touch the 200 EMA on the Weekly chart.
Let's see what happens.

Gut short RTS A good idea for opening position in short . Now the 5th wave of Wulf.
Short from level 1270 & up - here begins the 6 wave. TP 950-900


RTSRTS going to channel. All indicators show next move need go up.
Need go up with all US indexes and EU indexes


RTSI @ daily @ best index (of 55) 2016! While january`17 flat ?Take care
& analyzed it again
- it`s always your decision ...
(for a bigger picture zoom the chart)
This is only a trading capability - no recommendation !!!
Buying/Selling or even only watching is always your own responsibility ...
58 SHARE INDICES worldwide (2016 Yearly Performance) @ drive.google.com
Best regards
Aaron

RTSI weekly 1000&800 at Febr2017.RTSI weekly 1000&800 at Febr2017. MAY=500.
Alternative 1400 (1600).