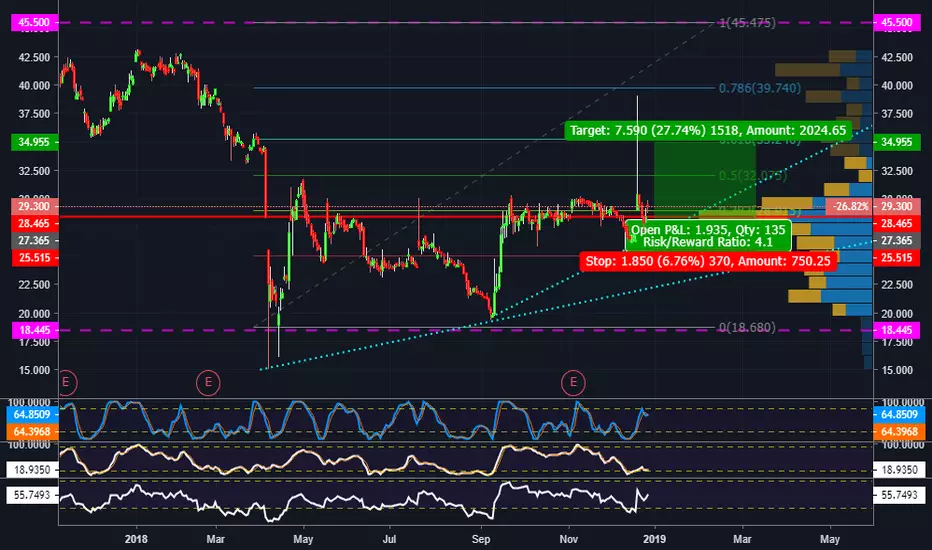
$RUAL need to brake the ceilingMOEX:RUAL has been moving in a horizontal channel for a long time and it's like a mouse in a trap - if it wants to stay free, it should accumulate a power, stay silent, push off and jump.
Idea is that we could observe the same behavior for this shares. It need to go down, touch the bottom below a bit of the mother channel, push off and jump to the top. It this happens, it will mean, that we will see a serious of such incredible victories in the future.
Buy - 39
Sell - 58
Period - 6-9 months.
Does not constitute a recommendation.
#furoreggs #investing #stocks #shares #idea #forecast #trading #analysis
If you want to discuss, please subscribe and challenge this point of view )
RUAL trade ideas

$RUAL promises a good results in a yearStable company with a sustainable business.
I expect, that is will show about 50% during the next 9 months.
MOEX:RUAL ::39->60::50%::March 2024
Does not constitute a recommendation
#investing #stocks #idea #forecast #furoreggs

A potential multibagger 3X to 5xWith a strong performance in Aluminium, Rusal will start to move out of long term downtrend. Price of Rusal has tested the based 3 times and poise for a potential breakout with a immediate resistance at $7. Rusal tend to have the strongest performance between April in the past and tend to fall sharply in Jan.
If price can break out and retest $6 , we expect it to grow towards $10 and follow by $13 by end of year
With an estimate to be $24 to $36.

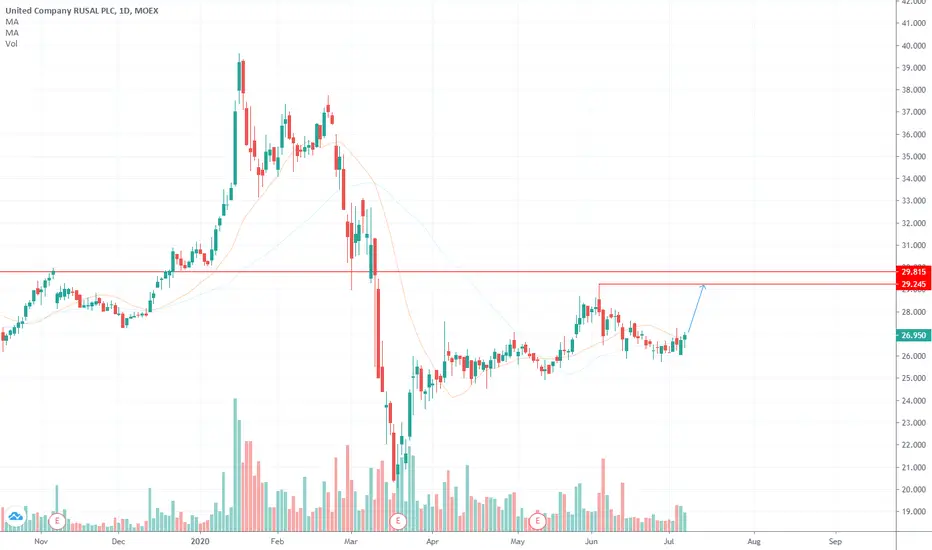
Rusal gets back on track of correlation to the price of aluminumImplementation of factors that will allow to gain a foothold at 75+ rubles per share in the near future until the end of the year.
Significant decrease in debt burden due to the sale of a stake in Norilsk Nickel and strong financial results in the next six months
Renewal of dividend payments
End of temporary duties from 1st January 2022
Launch of Taishir Aluminum Smelter in 2021
Highlighting dirty business

Traditional|RUAL|LongLong RUAL
Activation of the transaction only when the blue zone is fixed/broken.
The idea is to work out the resistance level .
* Possible closing of a trade before reaching the take/stop zone. The author can close the deal for subjective reasons, this does not completely cancel the idea and is not a call to the same action, you can continue working out the idea according to your data, but without the support of the author.
+ Maybe right now we will go even lower, then it's okay, the idea is not activated and simply canceled.
The "forecast" tool is used for more noticeable display of % (for the place of the usual % scale) of the price change, I do not put the date and time of the transaction, only %.
Blue zones - activation zones.
Green zones - take zones.
The red zone - stop zone.
Working out the stop when the price returns to the level after activation + fixing in the red zone.
Orange arrow - the direction of take.
Blue arrow - neutral scenario without activating the trade.
The red arrow - the direction of the stop.
SUM PNL: This parameter displays the total % of all closed ideas of the "new" format (according to the author) for this sector at the time of publication of the idea. The calculation is very "clumsy" just the sum of the profits of all the ideas, based on this indicator, you can more accurately assess the risks when working with my ideas of this sector. I present you the construction of the idea, you can use it yourself as you like based on your subjective view and risks, the calculation of the PNL indicator is carried out only on transactions that the author closed on TV in manual mode or by take.
P.S Please use RM (risk management) and MM (money management) if you decide to use my ideas, there will always be unprofitable ideas, this will definitely happen, the goal of the system is that there will be more profitable ideas at a distance.

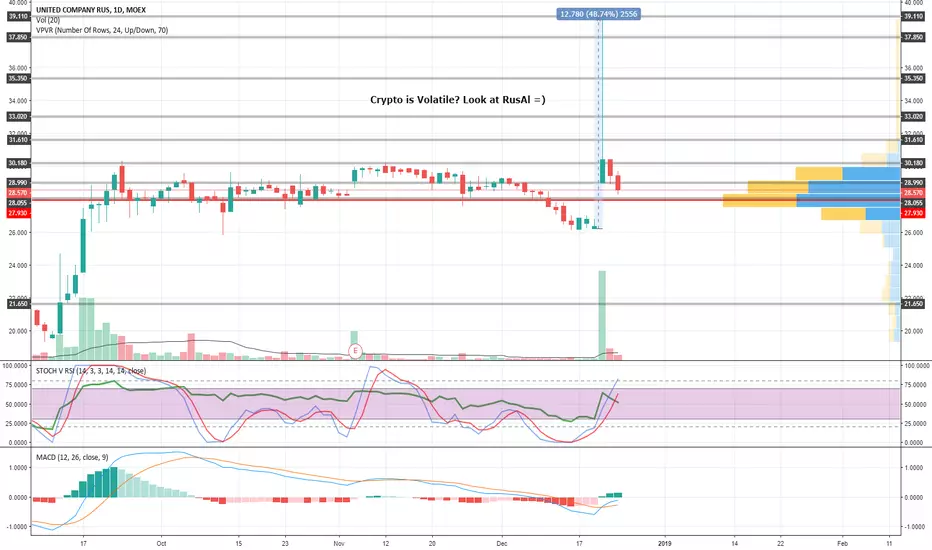
Rusal - how deep is the correction?Along with the sector (check #AA) #RUAL has dived in the correction.
Potential target is 50% Fibo level around 30.30rub


RusAL not Rus anymoreSomeone already made good profit on inside information. But there should be more. Will test support at ~28.35 once again and grow up. In couple of years I would start fixing profits around 58 and 65.
RUSAL - a good time to buyIt is probably a good time to buy RUAL as US lifts sactions!
This should attract a lot of investors.
RUAL