RVNUSDT0.117$ is a possible bottom, we can still go down some more all the way to about 0.085$ though.
RVNUSDT trade ideas


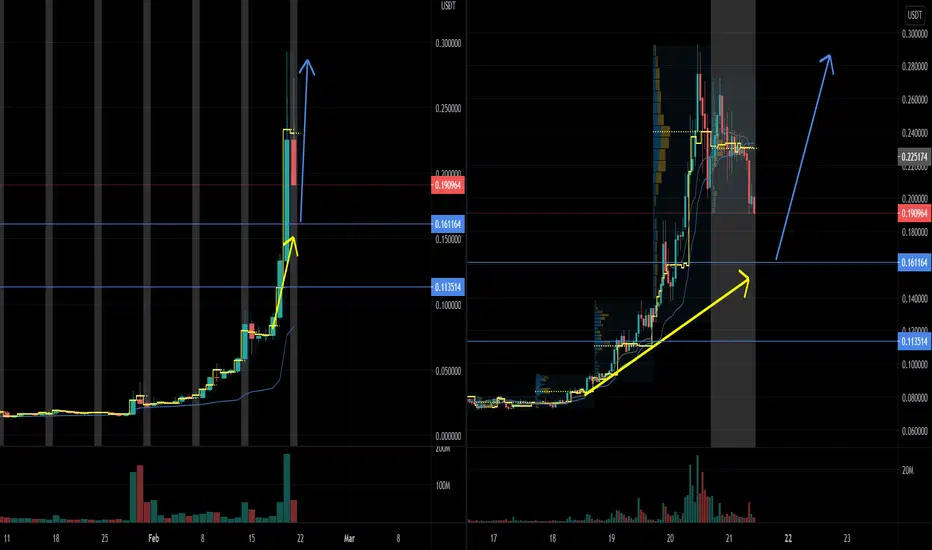
RVN / USDT RVN / USDT
📊 Pozisyon / Position : Long / Spot
🟢 Alış / Buy : 0,14688 USDT
🚀 Hedef / Target : 0,16175 USDT
YTD.

🚀Triangle RVNSupport the idea with like!)❤️
#RVN/USD
📌 Triangle RVN
🔹Analytics: I expect the break of the counter-trend line, the break will give a good setup for an upward movement!
Resistance lines - possible sell / correction, you can fix part of the position. All goals are shown on the chart. This is just my opinion, it may not coincide with yours.


RVNUSDT - SHORT - DESCENDING TRIANGLE #BINANCE
#RVNUSDT
IF BREAK Descending Triangle THEN LOOKING TO MORE BEARISH

RVN - Sleeping Giant is ready RVN perfect pullback to .618 and almost .786 as soon as it breaks the upper resistance line, look for another parabolic move.


🔥 RVN Correction InboundRVN has been one of the biggest winners of the last month, seeing crazy returns almost daily. Since it hit the ATH around 0.29, RVN has been declining however. RVN is severly overbought, no denying that. Combined with the bearish correction that Bitcoin is currently facing, RVN is well on its way to fall even further.
On the chart I’ve marked two potential areas of support, S1 and S2. These areas are based on recent swing lows. Do your own due diligence.
Happy trading!

Quick Update on RVNRVN is forming a big bull pennant. We should wait and see where BTC wants to go. otherwise this looks like it could break to the upside if btc doesn't go down.

RVN The Golden D-CurrencyDear Traders,
Fortunately on Friday I found RVN when the price was $0.11 and during one day I got 155% profit on it. Yesterday I closed it and today at 0.17$ I got one more position. Wave 5 still is available to make great profit.
The last point is $0.82. I hope you can enjoy the profit.

A quick sneak peek at RVN RVN is forming a big bull pennant, and if the 0.38 fib level can hold, then we could see a massive continuation.


Trying to get into a RAVUSD trade at prior supportEntering on prior support at POC worked well on other coins, RVNUSD had in prior weeks 3 days of consolidation and then a breakout, maybe we have to wait.
It all depends what happens at the support level, I will set my breakeven stop once I am in the trade soon.

keep on adding to my RVNUSD long tradeas long as there is a rising POC line I keep on adding to the RVNUSD trade, trailing stop below the 1 Hour Bar


Raven coin time for Reversal?Hello Trader , let s see what RVN is up to ,
we may say it did touch the bottom many days now (we can see the wicks on the daily)
and it s time for a trend reversal to the upside (targets on chart)
this is 1 DAY Chart, we have a buy signal on the RSI indicator up above.
If this is the reversal we need to see the next candles opening above the ribbon ( the red line ).
This is an early signal so patience is key.


Ravencoin (RVN)HI
RAVEN TIME... OH YES
Ravencoin is a blockchain specifically dedicated to the creation and peer-to-peer transfer of assets. Just as Monero is solely focused on privacy, Ravencoin specializes in asset transfer – nothing more, nothing less. Although you can exchange assets over other blockchains, like Bitcoin and Ethereum, that’s not their intended purpose. And the lack of specialization leads to problems that are specific to transferring assets. Ravencoin enables you to create and trade any real-world (e.g., gold bars, land deeds) or digital (e.g., gaming items, software licenses) assets on a network with only that in mind.
Ravencoin doesn’t have an established team. It’s an open-source project led by the core developers: RavoncoinDev, Tron, and Chatturga (discord usernames). Bruce Fenton, Board Member of The Bitcoin Foundation, advises the team. The core developers launched Ravencoin on January 3rd, 2018 and Fenton kicked off the launch with a Tweet announcing the start of mining. The project gained some notoriety when Overstock CEO Patrick Byrne announced that his company had made a multi-million dollar investment into the team. Since then, the team has been building out the core functionality of asset support and rewards capabilities..
TG 0.12--0.15--2
BYE

RVN Ravecoin Bullish breakout - RVNBTC RVNUSDT RVNUSD RVNBITCOINRVN Ravecoin Bullish breakout - RVNBTC RVNUSDT RVNUSD RVNBITCOIN

